Section 2: The Benefits of Access Management
Anchor: #i999066Overview
Below are some of the benefits that have been realized in communities with effective access management policies:
- Delaying or preventing costly highway improvements,
- Improving roadway safety conditions (reduced crash rates),
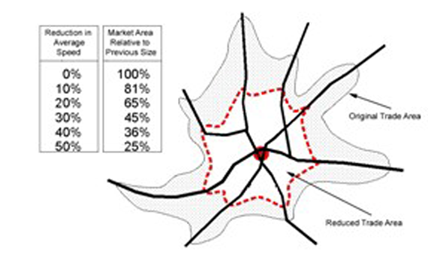
- Reducing traffic delay and congestion, which has a positive economic effect on market areas (as seen in Figure 1-4),
- Promoting properly designed access and circulation systems for development,
- Improving the appearance of transportation corridors and increasing the area available for landscaping, which can help attract investment and enhance the image of an area,
- Providing property owners and customers with safe access to roadways,
- Reducing air pollution, and
- Making pedestrian and bicycle travel safer.
Another significant benefit is that access management requires a more coordinated, long-term approach to land use and transportation; therefore, effective access management promotes intergovernmental cooperation relating to land development and transportation decisions.
Anchor: #i999451Effects on Safety
More than four decades of research conducted throughout the United States have shown that access management improves roadway safety. These safety benefits are attributable to improved access design, fewer traffic conflict locations, and higher driver response time to potential conflicts. Some key findings on the impacts of arterial access management on safety are summarized below.
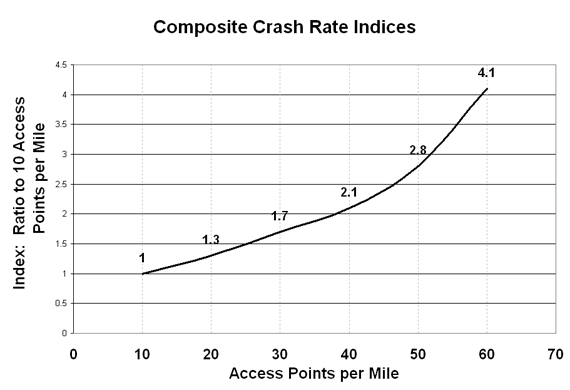
- As access density increases, crash rates
increase. Relative increases in crash rates are remarkably
consistent among the various studies. Figure 1-2 shows composite
crash rate indices derived from the analysis of 37,500 crashes,
as compared with a synthesis of previous studies2. The indices were developed by correlating
crash rates with access density - using the crash rates for 10 access
points per mile as a base and then averaging crash rates for each access
density. For example, these indices suggest that an increase from
10 access points to 20 access points per mile would increase crash
rates by roughly 30 percent.
Figure 1-2. Composite Crash Rates
- Roadways with nontraversable medians are safer
at higher speeds and at higher traffic volumes than undivided roadways
or those with continuous two-way left-turn lanes (TWLTL). Numerous
studies from across the nation have been conducted relating to undivided,
TWLTL, and divided roadways with a nontraversable median. Based
on studies, it can be concluded that roadways with a nontraversable
median have an average crash rate about 30 percent less than roadways
with a TWLTL. Table 1-1 summarizes the representative crash rates
by median type for urbanized areas. Additionally, where ADT exceeds
20,000 vehicles per day and the demand for mid-block turns is high,
a raised median should be considered.3
Anchor: #i1000452Table 1-1: Accident Rates Representative Accident Rates (Crashes Per Million VMT)
by Type of Median - Urban and Suburban Areas
Median Type
Total Access Points Per Mile (1)
Undivided
Two-Way Left-Turn Lane
Non-Traversable Median
< 20
3.8
3.4
2.9
20.01 - 40
7.3
5.9
5.1
40.01 - 60
9.4
7.9
6.8
> 60
10.6
9.2
8.2
Average Rate
9.0
6.9
5.6
(1) Includes both signalized and unsignalized access points.
Operational Effects
Frequent access connections, median openings, and closely spaced traffic signals are a recipe for congestion on major roadways (See Figure 1-3). Studies of the effects of access management on roadway operations have addressed effects of access spacing on travel time by simulating traffic performance. Collectively, these studies indicate that access management helps to maintain desired speed and reduce delays, which also reduces fuel consumption and vehicle emissions.
Figure 1-3. Signal Spacing and Queuing
For example, analysis based on procedures in the Highway Capacity Manual indicates that the typical reduction in free-flow speed (for one direction) is approximately 0.15 mph per access point and 0.005 mph per right-turning movement per hour per mile of road.4 Using the Highway Capacity Manual, Table 1-2 provides suggested access density adjustment factors for level of service determinations. These benefits extend not only to free-flow conditions, but to platoon flow as well.
|
Access Points and Free Flow Speed |
|
|---|---|
|
Access points per mile |
Reduction in free flow speed, mph |
|
0 |
0.0 |
|
10 |
2.5 |
|
20 |
5.0 |
|
30 |
7.5 |
|
40 or more |
10 |
Other analyses suggest that a four lane divided major roadway with long, uniform signal spacing, directional openings between signals, and auxiliary lanes could accommodate a similar volume and similar quality of service as a six lane divided roadway having traffic signals at ¼-mile intervals, unregulated access between the signals, and no auxiliary lanes.5
Minimizing the number of traffic signals and promoting appropriate signal spacing significantly improves travel times. Each traffic signal per mile added to a roadway reduces through travel speed about two to three mph. Table 1-3 indicates percentage increases in travel times that can be expected as signal density increases, using two traffic signals per mile as a base. For example, travel time on a segment with four signals per mile is about 16 percent greater than on a segment with two signals per mile.
|
Percentage Increase in Travel Times as Signalized Density Increases |
|
|---|---|
|
Signals Per Mile |
Percent Increase in Travel Times (Compared with 2 Signals Per Mile) |
|
2.0 |
0 |
|
3.0 |
9 |
|
4.0 |
16 |
|
5.0 |
23 |
|
6.0 |
29 |
|
7.0 |
34 |
|
8.0 |
39 |
Anchor: #i1001950
Economic Effects
A safe and efficient transportation system is an important element of a vibrant economy. The quality of the transportation system affects the economy in a variety of ways: it determines how quickly goods get to market, whether an area is attractive to investors, and the size of the market area for a particular business.
For real estate developers, the importance of well designed access and circulation systems cannot be overstated. The Urban Land Institute's (ULI) Shopping Center Development Handbook warns that "poorly designed entrances and exits not only present a traffic hazard but also cause congestion that can create a negative image of the center".6
The market area for a business is important to its success as well. Closely spaced or poorly designed access connections reduce average travel speeds and increase delay on the roadway. Market area analysis shows that these increases in average travel times result in longer commute times and reduce the market area for businesses. The National Highway Institute reports that inadequate access management can increase travel time and delay by as much as 40 to 60 percent.7 Yet, even a 10 percent reduction in average travel speeds can cause a business to lose 20% of its market area. Although the average size of market area varies for different types of businesses, the proportionate reduction in market area is the same. This relationship is illustrated in Figure 1-4.
Figure 1-4. Market Area, Speed Relationship8
The appearance of a corridor and quality of access to development also impact property values and investment. Property values tend to increase rapidly during commercial development, but can decline after the corridor is built out if the character and efficiency of that corridor have been damaged in the process. This is exemplified by the growing number of older highway commercial strips across the state that are now experiencing economic decline; many such areas are the subjects of revitalization efforts that include access management strategies.
Individual business owners are sometimes concerned about the potential impact of access management requirements on business activity. Studies conducted of businesses within areas where access management has been implemented show that improved driveway spacing and design, alternative access, and installation of nontraversable medians have virtually no adverse impact on business activity. For example, a study of the economic impacts of left-turn restrictions in College Station, Houston, McKinney, Longview, Wichita Falls, Odessa, Port Arthur, and Amarillo was conducted for the Texas Department of Transportation in the mid 1990s.9 Key findings relative to access management include the following:
- Business owners reported no change in pass-by traffic after median installation.
- Most business types (including specialty retail, fast-food restaurants, and sit-down restaurants) reported increases in numbers of customers per day and gross sales.
- When asked what factors were important to attracting customers, business owners generally ranked "accessibility to store" lower than customer service, product quality, and product price, and ahead of store hours and distance to travel.
A study of the effects of access management on business vitality was conducted in 1996.10 Before and after data were collected on a series of corridor case studies. Results indicated that:
- Corridors with completed access management projects performed better in terms of retail sales than the surrounding communities. Business failure rates along access managed corridors were at or below the statewide average.
- Close to 80 percent of businesses reported no customer complaints about access to their businesses after project completion.
- Over 90 percent of motorists surveyed had a favorable opinion of improvements made to roadways that involve access management. The vast majority of motorists thought that the improved roadways were safer and that traffic flow had improved.
The results of these and other studies indicate that access management has little or no adverse impact on business activity. Before and after studies indicate that business owner perceptions of the potential for adverse impacts of access changes tend to be much worse than actual impacts. In addition, levels of business activity often correlate more closely with factors such as competition, the regional economy, quality of management, and other issues unrelated to property access.
2. Gluck, J., H.S. Levinson and V.G. Stover, NCHRP Report 420: Impacts of Access Management Techniques, National Cooperative Highway Research Program, Transportation Research Board, Washington, D.C., National Academy Press, 1999.
3. Texas Department of Transportation (TxDOT), Roadway Design Manual, 2002.
4. Reilly, W., et al.,.Capacity and Service Procedures for Multi-lane Rural and Suburban Highways,. Final Report NCHRP Project 3-33, JHK & Associates and Midwest Research Institute, May 1989.
5. S/K Transportation Consultants, Inc., National Highway Institute Course No. 133078: Access Management, Location and Design, April 2000.
6. Urban Land Institute (ULI), Shopping Center Development Handbook, Second Edition, Washington, D.C., 1985.
7. Reilly, W., et al.,.Capacity and Service Procedures for Multi-lane Rural and Suburban Highways,. Final Report NCHRP Project 3-33, JHK & Associates and Midwest Research Institute, May 1989.
8. Stover, V. and F. Koepke, Transportation and Land Development, Institute for Transportation Engineers (ITE), 1988, 2002.
9. Eisele, W. and W. Frawley,.A Methodology for Determining Economic Impacts of Raised Medians: Data Analysis on Additional Case Studies,. Research Report 3904-3, Texas Transportation Institute, College Station, TX, October 1999.
10. Iowa State University, Iowa Access Management Research and Awareness Project: Executive Summary, 1997.


