Section 3: Transversely Varying Asphalt Rates
Anchor: #i1028853General
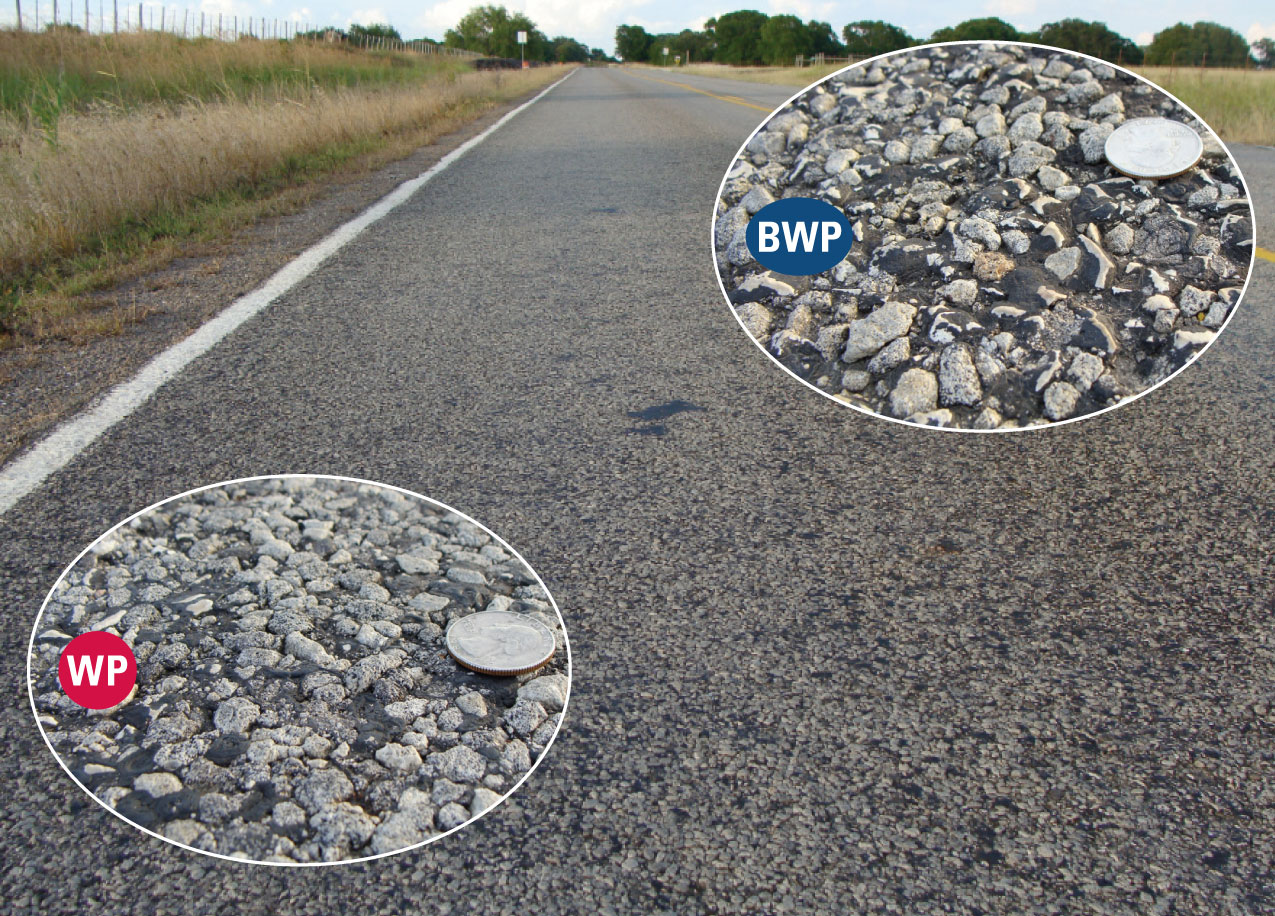
Transverse variation of asphalt rate (TVAR) is the seal coat practice of varying the amount of asphalt being applied across the width of the pavement to better match the asphalt needs of the existing pavement. Figure 4-2 shows a pavement where the texture varies across a pavement and is a prime candidate for using the TVAR technique. The reason becomes more obvious in the inset images of the magnified pavement surfaces in the wheel path, on the right, and outside of the wheel paths, on the left. One can readily see that less new asphalt is needed in the wheel paths to hold the new aggregate than is needed between the wheel paths. Between the wheel paths, there is some texture that needs to be filled with asphalt before the remaining asphalt can effectively embed and hold the new aggregate. So when shooting one rate across the pavement width, either there is more asphalt than needed in the wheel paths, with the obvious consequences, or you have at best marginal asphalt being placed between the wheel paths, which increases the chance of losing aggregate.�
Figure 4-2. Pavement texture varying across a pavement.
TVAR can improve the performance of seal coats, particularly those placed on pavements with flushed wheel paths. Existing wheel path flushing can be reduced and sometimes eliminated, thereby significantly improving skid properties of the roadway while still providing adequate asphalt outside of the wheel paths to hold the new aggregate.�
A common misconception is that TVAR reduces the amount of asphalt being placed on the roadway. TVAR actually increases the total amount of asphalt being used if prior practice has been to design the asphalt rate based only on wheel path conditions.�
Optimal performance requires that the wheel path need for asphalt be met as accurately as possible. Then with TVAR, the asphalt rate outside of the wheel paths is increased. The net result is that more asphalt is usually placed on the roadway than would have otherwise occurred.�
Anchor: #i1016040Considering Why and When to Require TVAR�
Why Use TVAR? The purpose of using TVAR is to improve roadway safety and increase seal longevity. If prior practice has been to attempt to average the need for asphalt across the pavement being sealed, future use of TVAR will both diminish the occurrence or reoccurrence of wheel path flushing and improve aggregate retention outside of the wheel paths. These improvements will increase skid resistance, providing a safer roadway for the travelling public.�
TxDOT districts frequently using TVAR report that TVAR improves seal coat performance. In some cases it is possible to completely eliminate the return of wheel path flushing.�
Asphalt and Aggregate Considerations. Asphalt type and grade are not factors when considering the use of TVAR. Districts using this seal coat method specify both hot asphalt cements and emulsions. TVAR has limited but successful use with asphalt rubber.�
Aggregate type is not a factor. Districts have successfully used lightweight and hard rock aggregates, precoated and plain aggregates, and grades 3 and 4.
Existing Pavement Type Considerations. TVAR seal coats may be placed on any pavement surface. However, their greatest value is obtained when placed over existing seal coats where flushing has significantly reduced texture in the wheel paths. It is recommended that districts without experience with TVAR begin with applications over existing seal coats with wheel path flushing.�
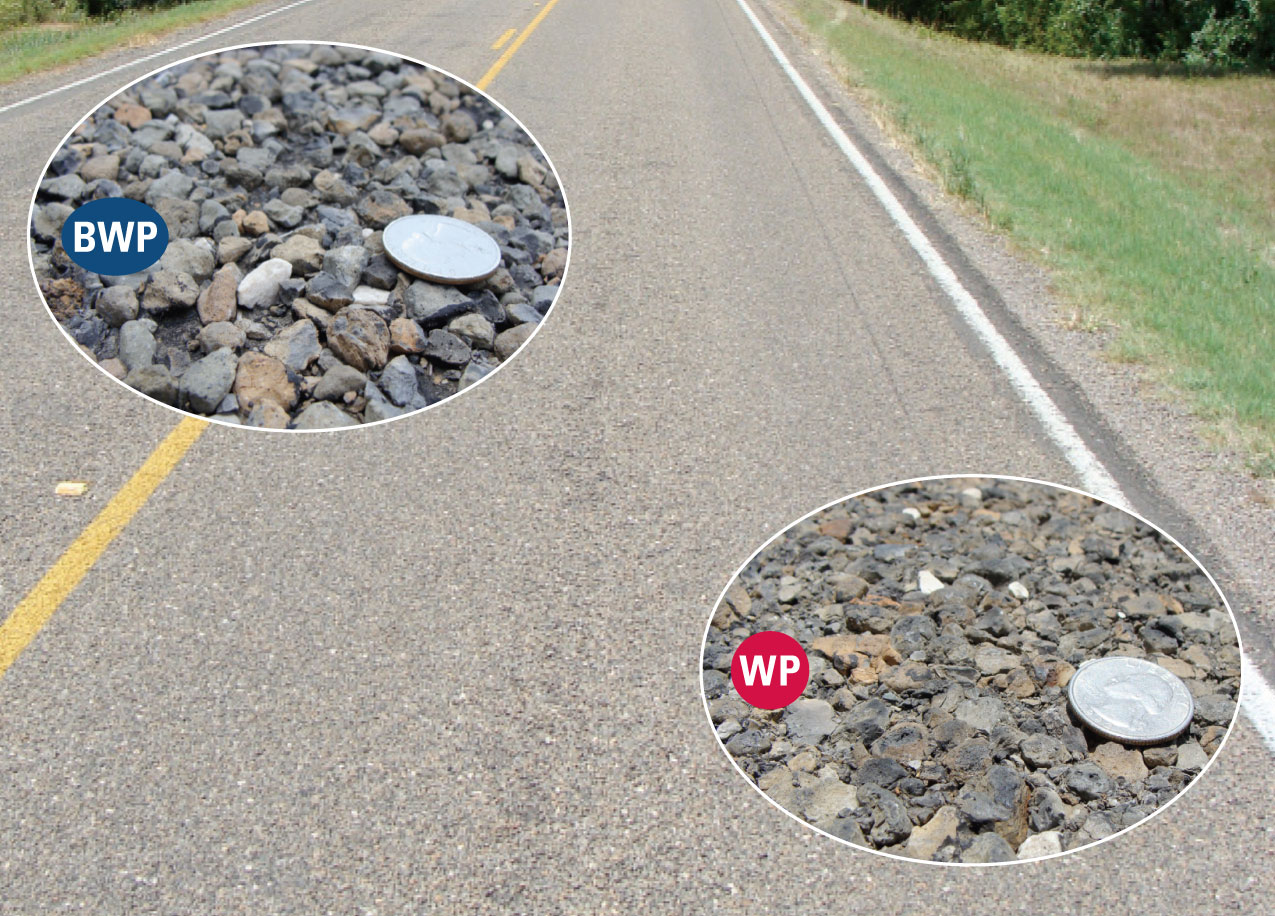
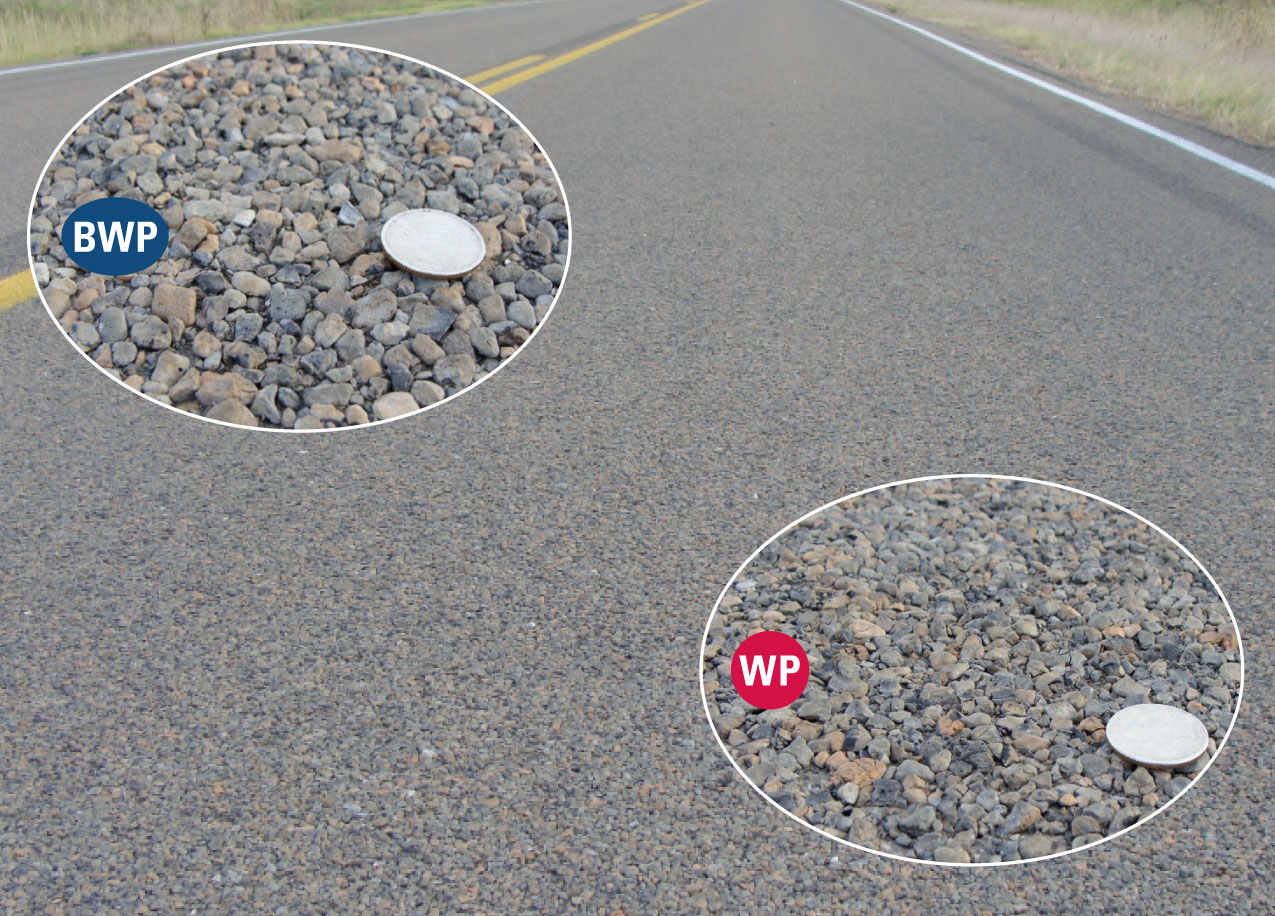
Selecting Roadway Sections Appropriate for TVAR by Visual Appearance. The degree to which texture differs across the roadway is a direct indicator of desirability to transversely vary the asphalt rate. Figures 4-3 through 4-9 show pavements where textures vary across the roadway to differing degrees. The first five pavements are desirable candidates for TVAR use, and the sixth and even the seventh may be possibilities if the contractor’s equipment is capable of small percentage TVARs.�
The conditions of the roadway wheel paths in Figures 4-3 and 4-4 clearly indicate need for corrective action. While TVAR should be used when the next seal coat is placed on roadways similar to these two, other corrective treatments are usually required in addition to TVAR to obtain significant and long term wheel path texture improvements. �
The roadways in Figures 4-5, 4-6, and 4-7 have somewhat less wheel path flushing. These are ideal situations for improving future seal coat performance with TVAR.�
The lane in Figure 4-8 has a just-perceptible wheel path color difference. It is a candidate for TVAR only if the contractor can vary the asphalt rate by small percentages. �
The lane in Figure 4-9 has no readily visible texture difference in the wheel paths. This pavement surface is a one-year-old maintenance seal coat within the limits of a district seal coat program pavement. Pavements in this condition are definitely inappropriate for higher percentage TVAR and usually are not given an even smaller percentage TVAR treatment.�
For Figures 4-3 through 4-9, “WP” in the red circle represents a close up of the wheel path, and “BWP” in the blue circles represents a close-up of the road section between the wheel paths.�
Figure 4-3. Lane with severe flushing.�
Figure 4-4. Lane with moderate to severe flushing.�
Figure 4-5. Lane with moderate flushing.
Figure 4-6. Lane with mild to moderate flushing.
Figure 4-7. Lane with mild flushing.
Figure 4-8. Lane with slight wheel path color difference.
Figure 4-9. Lane with no wheel path color difference.
Current practitioners have identified several situations where they recommend avoiding TVAR use:�
- Anchor: #CJOWFDMA
- When a Grade 5 aggregate is being used� Anchor: #BYYDTLSI
- When shooting emulsions on full super-elevated curves, as it may increase asphalt migration prior to rock placement� Anchor: #VVVLSQTN
- On new construction because the degree of potential benefit is small compared to potential loss of performance due to smaller amounts of asphalt sealing the pavement where stresses are the greatest� Anchor: #FCPEXLTJ
- On shoulders and other non-traffic locations� Anchor: #YOSMFXYM
- In continuous left-hand turn lanes where traffic patterns are random� Anchor: #WNYCIRWS
- In intersections where the side street also carries considerable traffic volume Anchor: #SIXURCIG
- On flushed or bleeding hot mix pavements that may have stripping or an otherwise unstable pavement layer below.�
Specifying TVAR�
Since Standard Specification Item 316 already allows transverse variation in asphalt rate, it is only necessary to insert a note in the plans that invokes and further defines this requirement. The recommended plan note is:�
“In addition to other asphalt distributor requirements, the asphalt distributor shall be capable of providing a transversely varied asphalt rate. The Contractor shall demonstrate that the distributor can apply an asphalt rate outside of the wheel path locations between 22 and 32 percent higher than the asphalt rate being applied in the wheel paths. The contractor’s calibration of the distributor will include verification of this capability and a description of the spray bar(s) and nozzles to be used. The percentage difference in asphalt rate provided by each tested spray bar and nozzle arrangement shall be provided to the Engineer. The Engineer will select the pavements where the transversely varied asphalt rate is to be provided.”�
Requiring that contractors be able to provide at least one TVAR between 22 and 32 percent should allow every contractor to meet this requirement by using differing standard nozzle sizes across a single spray bar. A study of nozzle sizes conducted in the Brownwood District determined this percentage range.�
Some contractors have distributors with dual spray bars and separate computer controllers. These contractors have the ability to vary asphalt rates over a much broader range than that suggested for the plan note.�
Anchor: #UFGKTFEQDetermining Design Asphalt Rates for Wheel Paths�
The design asphalt rate for each roadway must always be the rate deemed optimal for the wheel paths to hold the new wheel path aggregate without the asphalt later flushing to the surface. The first section of this chapter, “Modified Kearby Design Method,” describes the method for determining design rate for the wheel paths.�
Anchor: #RHUNMGMFDetermining TVAR Percentage for Outside the Wheel Path
Once the design asphalt rate has been determined for the wheel paths of a given roadway, the next decision is whether the asphalt rate should be increased outside of the wheel paths and, if so, how much it should be increased.�
TVAR With Single Bar Distributors. When the contractor is using a distributor with a single spray bar and only one TVAR increase is practical, the decision to be made is whether or not to vary the asphalt rate on a given pavement. TVAR is recommended in the specified 22 to 32 percent range whenever wheel path flushing is as evident as in the roadways shown in Figures 4-3 through 4-7. Otherwise, no variation in asphalt rate is usually the best choice.�
TVAR With Dual Bar Distributors. When the contractor has the capability of varying asphalt rates at percentages below the specified range, such as when using dual spray bar distributors, a broader and more optimal use of TVAR is possible. An asphalt rate increase between 10 and 15 percent is also recommended for roadways similar to the one shown in Figure 4-8. An asphalt rate increase of no more than 10 percent is recommended if TVAR is to be used on sections of roadway similar to Figure 4-9.�
Dual spray bar distributors provide inspectors the flexibility to vary asphalt rates in small increments throughout their broad ranges of variation capability. Experienced inspectors are able to take advantage of this flexibility and prescribe small incremental changes in TVAR from one asphalt shot to the next based on small differences observed in the pavement being sealed. Seal coat contractors with a lot of TVAR experience can often provide good advice to be considered by the inspector. When neither the inspector nor the contractor has considerable experience in transversely varying the asphalt rate, it is suggested that the decision making be simplified to choosing between three options: no increase, 15 percent increase, and 30 percent increase. The decision between these three may be based on comparison of the roadway to be sealed to the roadways in Figures 4-3 through 4-9.�
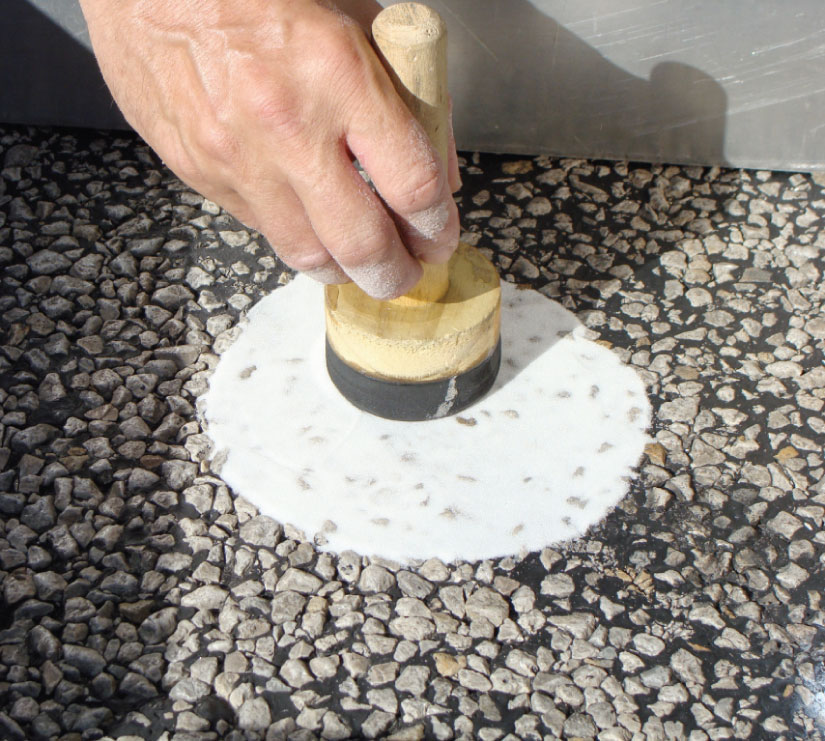
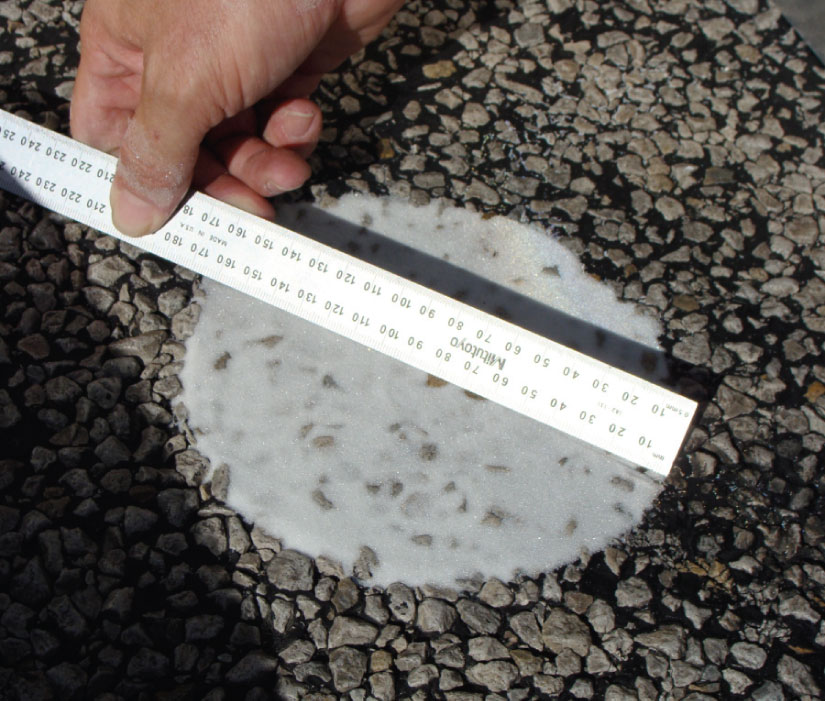
Texture Testing When Uncertain About TVAR. A simple and quick pavement surface test is available and should be used when there is any uncertainty about the TVAR difference to be selected. This is the sand patch test, which takes only minutes to run and is described in Tex-436-A.�
Figures 4-10 and 4-11 show this test being performed on a pavement surface.�
On windy days, the test may be performed inside a wind shield as is being used in Figure 4-10. The diameter of the resulting “patch” will vary as pavement texture varies because the same volume of sand is always used. The greater the volume of void space created by the pavement’s texture, the smaller the patch diameter will be. The difference in patch diameters when the test is run in the wheel path and between the wheel paths gives a quick and revealing indication of the appropriate variation in the asphalt rate to use.�
Figure 4-10. Spreading the sand to the level of the highest aggregates.�
Figure 4-11. Measuring four diameters of the resulting circle for averaging.�
To give an indication of how sand patch diameters vary on different pavement textures, the average diameters found when testing the sections of pavement shown in Figures 4-3 through 4-9 are shown in Table 4-6. The test results can reveal texture differences across the roadway that otherwise would go undetected if relying solely on visual observation. The notes below Table 4-6 describe two such instances.�
|
Roadway and Condition |
Sand Patch Average Diameters, mm |
||
|---|---|---|---|
|
Wheel Path |
Between Wheel Paths |
Difference |
|
|
Figure 4-3 – Severe Flushing of Grade 3 Seal Coat |
199 |
111 |
88 |
|
Figure 4-4 – Moderate to Severe Flushing of Grade 3 Seal Coat |
200 |
117 |
83 |
|
Figure 3-5 – Moderate Flushing of Grade 3 Seal Coat |
174 |
129 |
45 |
|
Figure 4-6 – Mild to Moderate Flushing of Grade 3 Seal Coat |
177 |
129 |
48 |
|
Figure 4-7 – Mild Flushing of Grade 3 Seal Coat |
184 |
121 |
63* |
|
Figure 4-8 – Slight Color Difference across Recent Grade 4 Seal Coat |
121 |
99 |
22 |
|
Figure 4-9 – No Visible Color Difference across Recent Grade 4 Seal Coat |
121 |
112 |
9** |
NOTE: * This higher difference was at first surprising until close observation of the pavement in Figure 4-7 revealed that some of the aggregate has been lost between the wheel paths, exposing a sharper underlying aggregate. This sharper aggregate between the wheel paths apparently increased the difference in texture across the roadway beyond what would have otherwise been expected.�
** The sand patch test revealed a difference in pavement texture in the wheel paths even though no visual indication could be observed.�
Table 4-7 provides general guidance for relating sand patch test results to desirable asphalt rate increases for outside of the wheel paths. It is recommended that a minimum of four randomly spaced locations be tested and the results averaged.�
|
Difference in Sand Patch Average�Diameters, mm |
Asphalt Rate Increase Outside of�Wheel Paths* |
|---|---|
|
Less than 20 |
None |
|
21 to 50 |
15% |
|
Greater than 50 |
30% |
NOTE: *The user is cautioned that the guidance in Table 4-7 is based on limited data and it only considers difference in pavement texture across the roadway. Users are encouraged to refine these parameters based on their own experience with local materials sources and climatic and traffic conditions.�
Anchor: #YLSHNUSBCalibrating and Inspecting the Asphalt Distributor for TVAR�
There are several additional distributor checks which should be done by the contractor and observed by the inspector when TVAR is used.
Nozzle Selection and Position. The selection of nozzles to provide the desired asphalt rate variation is a contractor decision to be verified during the additional distributor calibration run or runs.�
The inspector, however, must define the desired wheel path locations to allow the contractor to position the larger nozzles appropriately. Potential nozzle configurations to establish three-foot wheel path locations for various roadway widths are shown in Table 4-8. Many factors affect where the majority of traffic will track on a given roadway. The inspector may elect to use a different nozzle configuration than that shown to better approximate average wheel path locations on given roadways.
|
Lane Width,�Feet |
Center Line to�Wheel Path�Nozzles |
Inside Wheel Path Nozzles |
Between Wheel�Path Nozzles |
Outside Wheel�Path Nozzles |
Wheel Path to�Pavement Edge�Nozzles |
|---|---|---|---|---|---|
|
9 |
1 |
9 |
6 |
9 |
2 |
|
10 |
2 |
9 |
6 |
9 |
4 |
|
11 |
4 |
9 |
6 |
9 |
4 |
|
12 |
5 |
9 |
8 |
9 |
5 |
|
12 (with edge line) |
6 |
9 |
8 |
9 |
4 |
|
13 |
7 |
9 |
8 |
9 |
6 |
NOTE: This table is based on recommendations provided by the Brownwood and Bryan Districts.�
Setting Computerized Distributor Controls. Modern asphalt distributors have computer controls for the asphalt rates to be applied. The contractor and inspector must understand the meaning of the asphalt rate entered into the distributor’s computerized controller(s).�
When a distributor with a single spray bar is being used, unless otherwise indicated in the distributor’s operation manual, the computer setting establishes the total amount of asphalt to be applied. Therefore, when transversely varying asphalt rate with a single spray bar, the correct asphalt rate to be set on the distributor’s computer controller is the average asphalt application rate. The average asphalt application rate is determined by the formula below.�
[(L/100) x (V/100) x R] + R = Average Rate
Where�
L = % of larger nozzles = (number of larger nozzles/total number of nozzles) x 100�
V = % increase in asphalt rate selected for outside of the wheel paths, and�
R = design rate of asphalt application for the wheel paths in gallons/SY.�
Correct determination and entry of the average asphalt rate into the distributor’s computer controller is a critical point for inspection prior to beginning TVAR seal coat operations. When a distributor with dual spray bars and having separate computer controllers is being used, the asphalt rate to be entered into each computer is the specific rate expected from the spray bar that each computer controls. Equipment operator’s manuals should be consulted to verify proper computer entries.�
Calibrating the Distributor to be Used for TVAR. The asphalt distributor must be calibrated as required for uniform asphalt rate applications as well as being demonstrated capable of applying asphalt at the TVAR percentage(s).�
When the distributor is capable of varying the asphalt rate incrementally and over a wide range, the inspector should request that the contractor demonstrate specified application accuracy and uniformity with no asphalt variation across the bar and also at two variation rates, 15 and 30 percent. Proving ability to apply asphalt in these three manners adequately demonstrates capability throughout the covered range provided that the same selection of nozzle sizes is being used.�
Anchor: #UMIRKJUKDetermining When Adjusting TVAR Is Appropriate�
Observations of the resulting seal coat are the basis for adjusting TVAR percentages or for going back to uniformly applied asphalt. The same inspection techniques appropriate for determining if uniformly applied asphalt rates are proper are used when inspecting TVAR seal coats.�
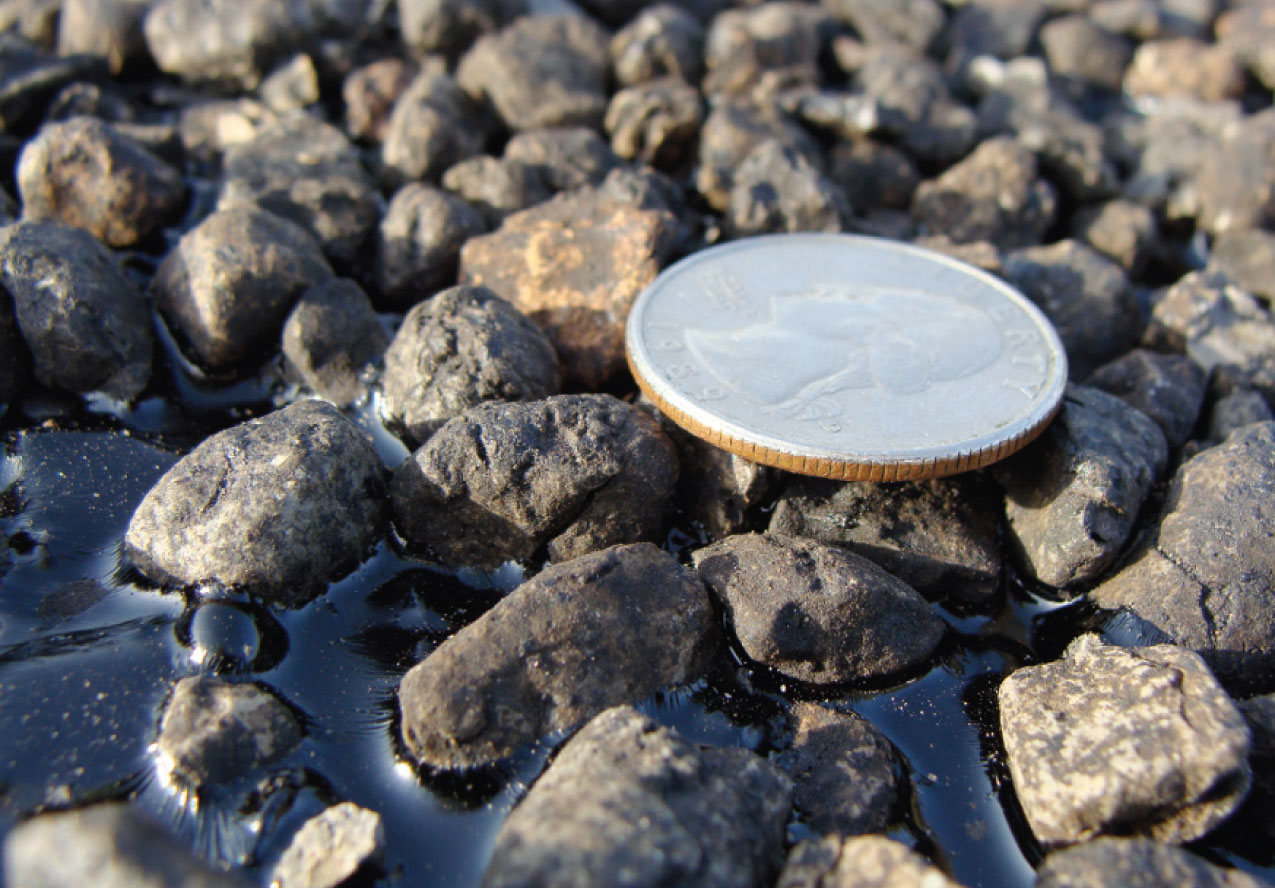
Primarily, inspection is by observation of embedment depth both inside and outside of the wheel paths. The inspector should observe embedment depths immediately after rolling and then later after the pavement has been exposed to traffic for a day or two. Normally, approximately 30 percent embedment is desired in the wheel paths after rolling. Slightly higher embedment percentages outside of the wheel paths are satisfactory immediately after rolling. Wheel path aggregate embedment should ideally be seen to increase to 35 to 40 percent within several days under traffic.�
Figure 4-12 may be helpful in making this determination as it shows a maximum desirable embedment percentage after several days of traffic.�
Figure 4-12. Wheel Path Aggregate Embedment Close-Up.


