Section 4: Profiles
Public driveways and commercial driveways should be constructed with a vertical curve between the pavement cross-slope and the driveway approach and between changes in grade within the driveway throat length. A private residential driveway may be constructed without vertical curves provided that a change in grade does not adversely affect vehicle operations. Typically, a change in grade of 3 percent or less and a distance between changes in grade of at least 11-ft accommodates most vehicles. However, literature suggests that a 6 percent to 8 percent change in grade may operate effectively. Individual site conditions should be evaluated to accommodate the vehicle fleet using the driveway. Refer to AASHTO's A Policy on Geometric Design of Highways and Streets and NCHRP Report 659 Guide for the Geometric Design of Driveways for additional information.
Anchor: #i1007405Driveway Grades
To achieve satisfactory driveway profiles, some of the significant factors to be considered are:
- Anchor: #MBCOUHIO
- Abrupt grade changes,
which cause vehicles entering and exiting driveways to move at extremely
slow speeds, can create:
-
Anchor: #TCFBSTNG
- The possibility of rear end collisions for vehicles entering the driveway, and Anchor: #NAXPKMDN
- The need for large traffic gaps that may be unavailable or infrequent, causing drivers to accept inadequate gaps.
Anchor: #GQCUVIVC - Where a driveway is expected to cross a pedestrian or bicycle facility now or in the future, special design requirements may apply. Refer to Chapter 6, Section 4 – Bicycle Facilities and Chapter 7, Section 3 – Pedestrian Facilities for more information. Anchor: #QNSRILME
- The comfort of vehicle occupants and potential vehicle damage (i.e. prevent the dragging of center or overhanging portion of passenger vehicles). Anchor: #SDSKOXIW
- Grades must be compatible with the site requirements for sight distance and drainage to prevent excessive drainage runoff from entering the roadway or adjacent property.
Because a large combination of slopes, tangent lengths, and vertical curves will provide satisfactory driveway profiles, some generalizations should be considered relative.
On curb and gutter sections, placement of vertical curves should be at the projected gutter line and not closer to the travel lanes unless curb and gutter returns and proper drainage are provided. The entire curb and gutter for the length of the curb cut should be removed and the gutter pan recast as an integral part of the driveway apron. When a curved radius is used, the curb and gutter should continue through the radius return. No gap in the curb and gutter should be allowed withing the radius return unless the gap is provided to accommodate a curb ramp when crossing a bicycle or pedestrian facility.
Profile vertical curves may not be practical for urban roadways with short driveway lengths.
As shown in Table C-4, the suggested maximum changes in driveway grades with a vertical curve (between the pavement cross slope and the driveway apron slope) are approximately 10 percent for private residential driveways and approximately 8 percent for all other driveways.
|
Driveway |
Change in Grade (A)1 |
|---|---|
|
Private Residential Driveways |
10% |
|
All Other Driveways |
8% |
|
Notes:
|
|
Construction practice can provide a suitable sag vertical curve between the pavement cross-slope and the driveway apron when the apron length La (see Figure C-8) is greater than or equal to 20-ft.
Figure C-8. Suggested Dimensions to Achieve an Appropriate Vertical Curve
Where possible, the driveway grade should be limited to 6 percent or less within the roadway right-of-way. Maximum driveway grades are up to 12 percent for private residential driveways and up to 8 percent for other driveways. Other driveway grades may be considered on a case by case basis.
The length of the vertical curve between the pavement cross-slope and the driveway apron is a function of the algebraic difference in the grades. Table C-5 provides the desirable and minimum lengths for these vertical curves.
|
Change in Grade, A |
Crests |
Sags |
||
|---|---|---|---|---|
|
Des. |
Min. |
Des. |
Min. |
|
|
ft |
ft |
ft |
ft |
|
|
4-5% 6-7% 8-10% |
5 6 8 |
3 4 5 |
7 8 10 |
4 5 7 |
The length of the vertical curve at other points of driveway grade change is also a function of the algebraic difference in the grades. Table C-6 provides the typical lengths for these vertical curves.
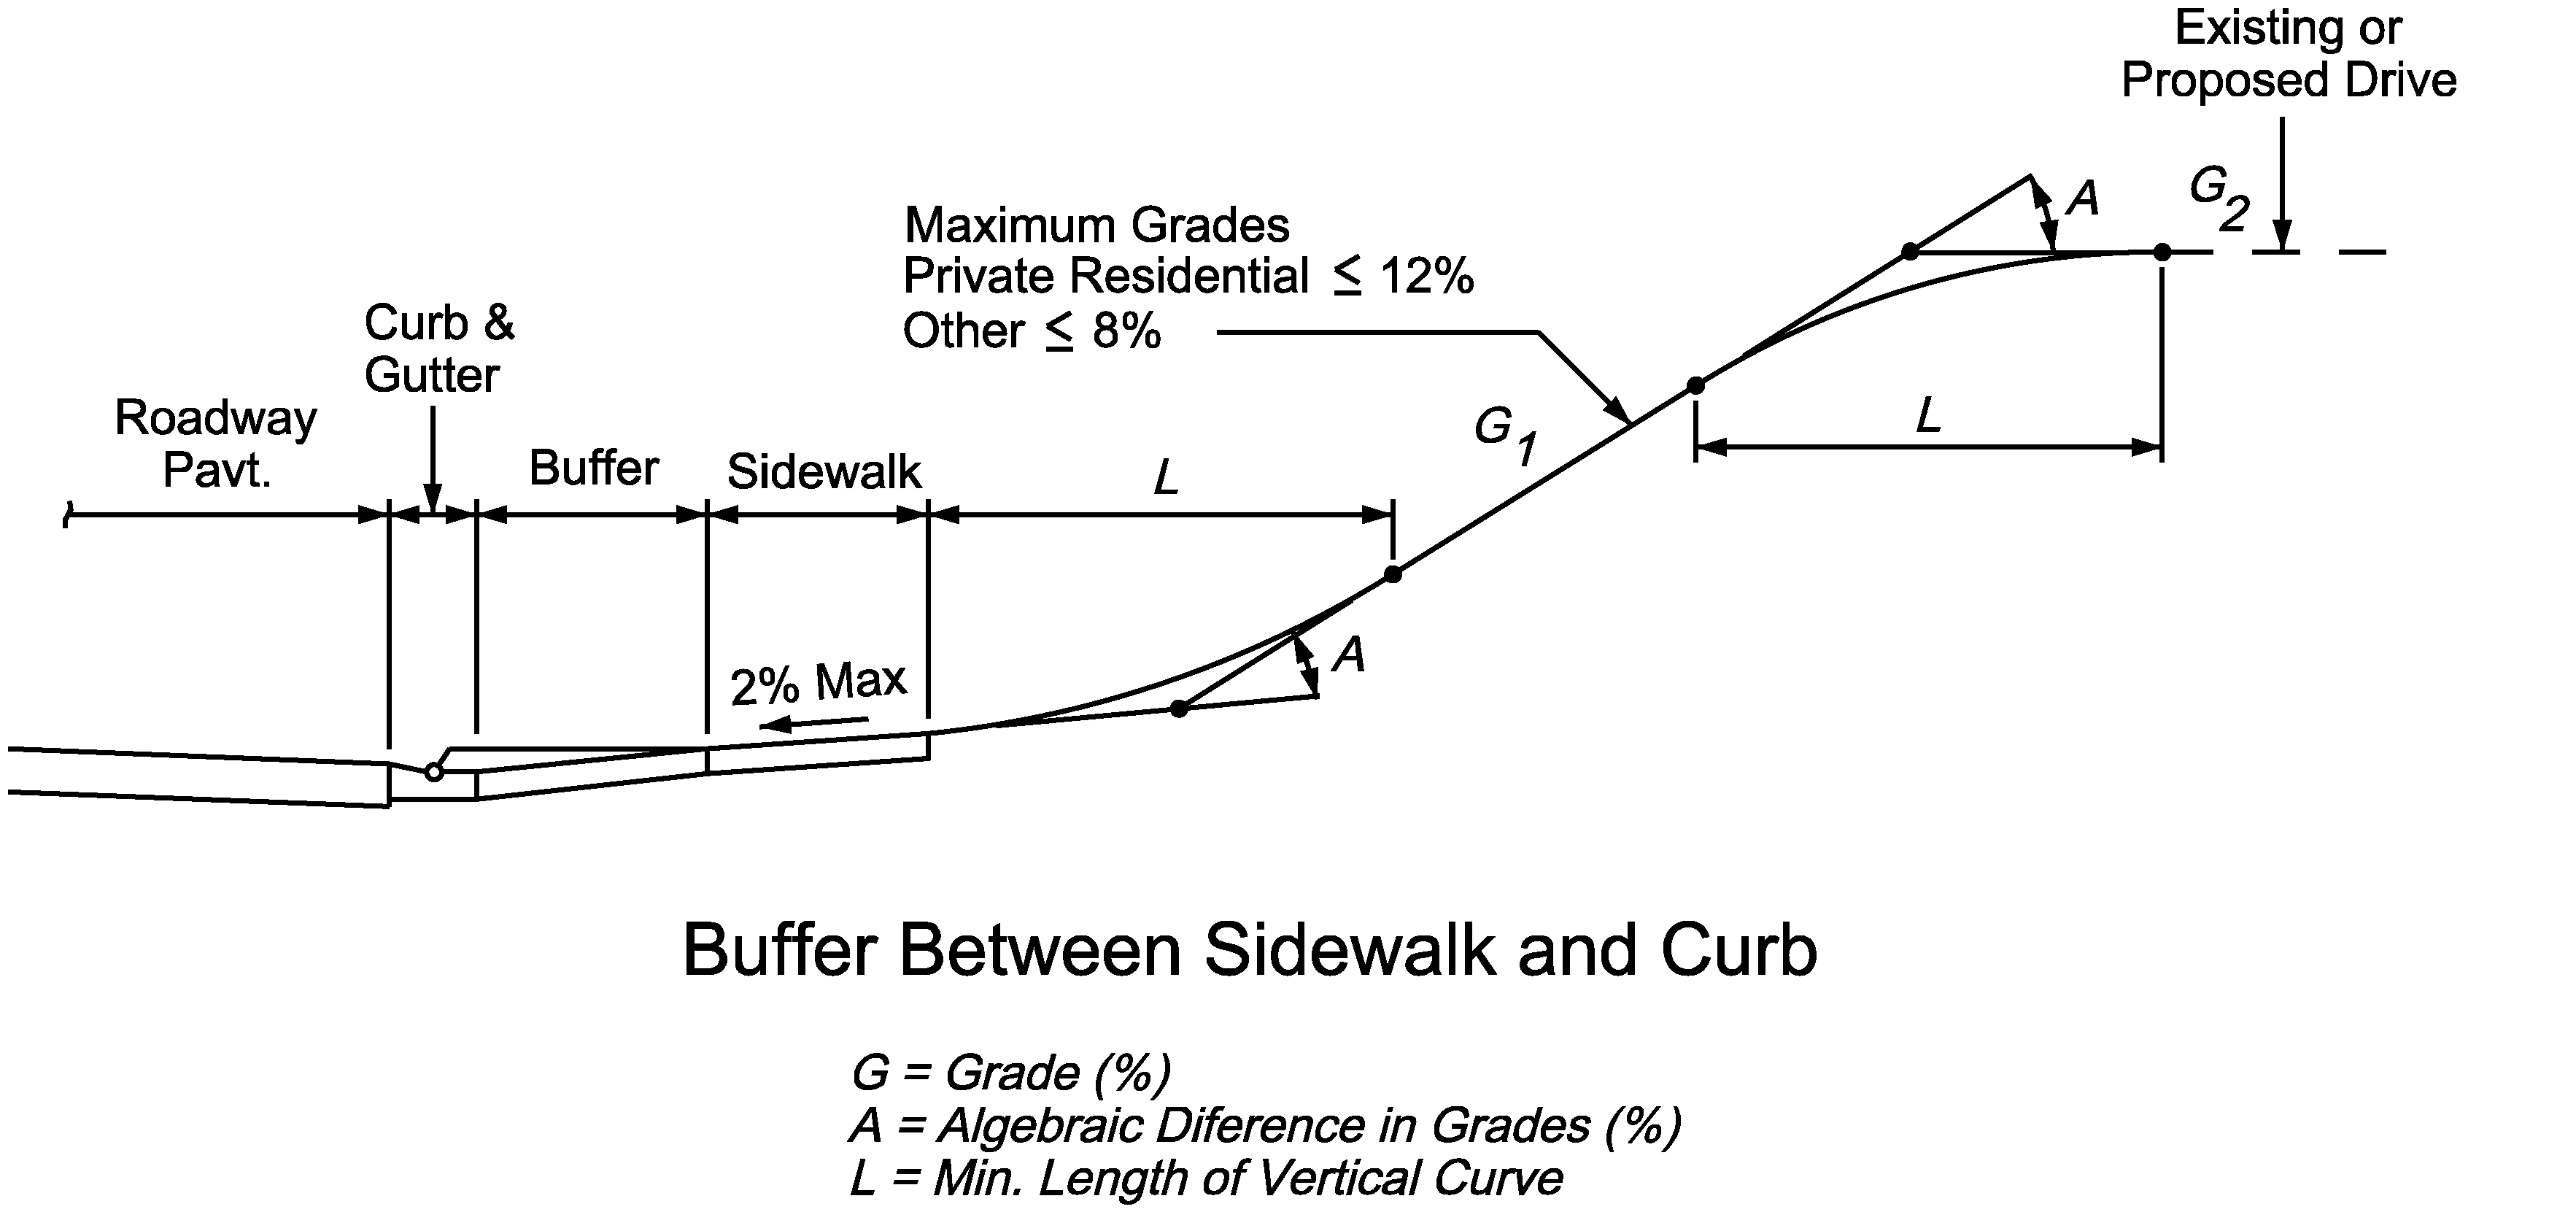
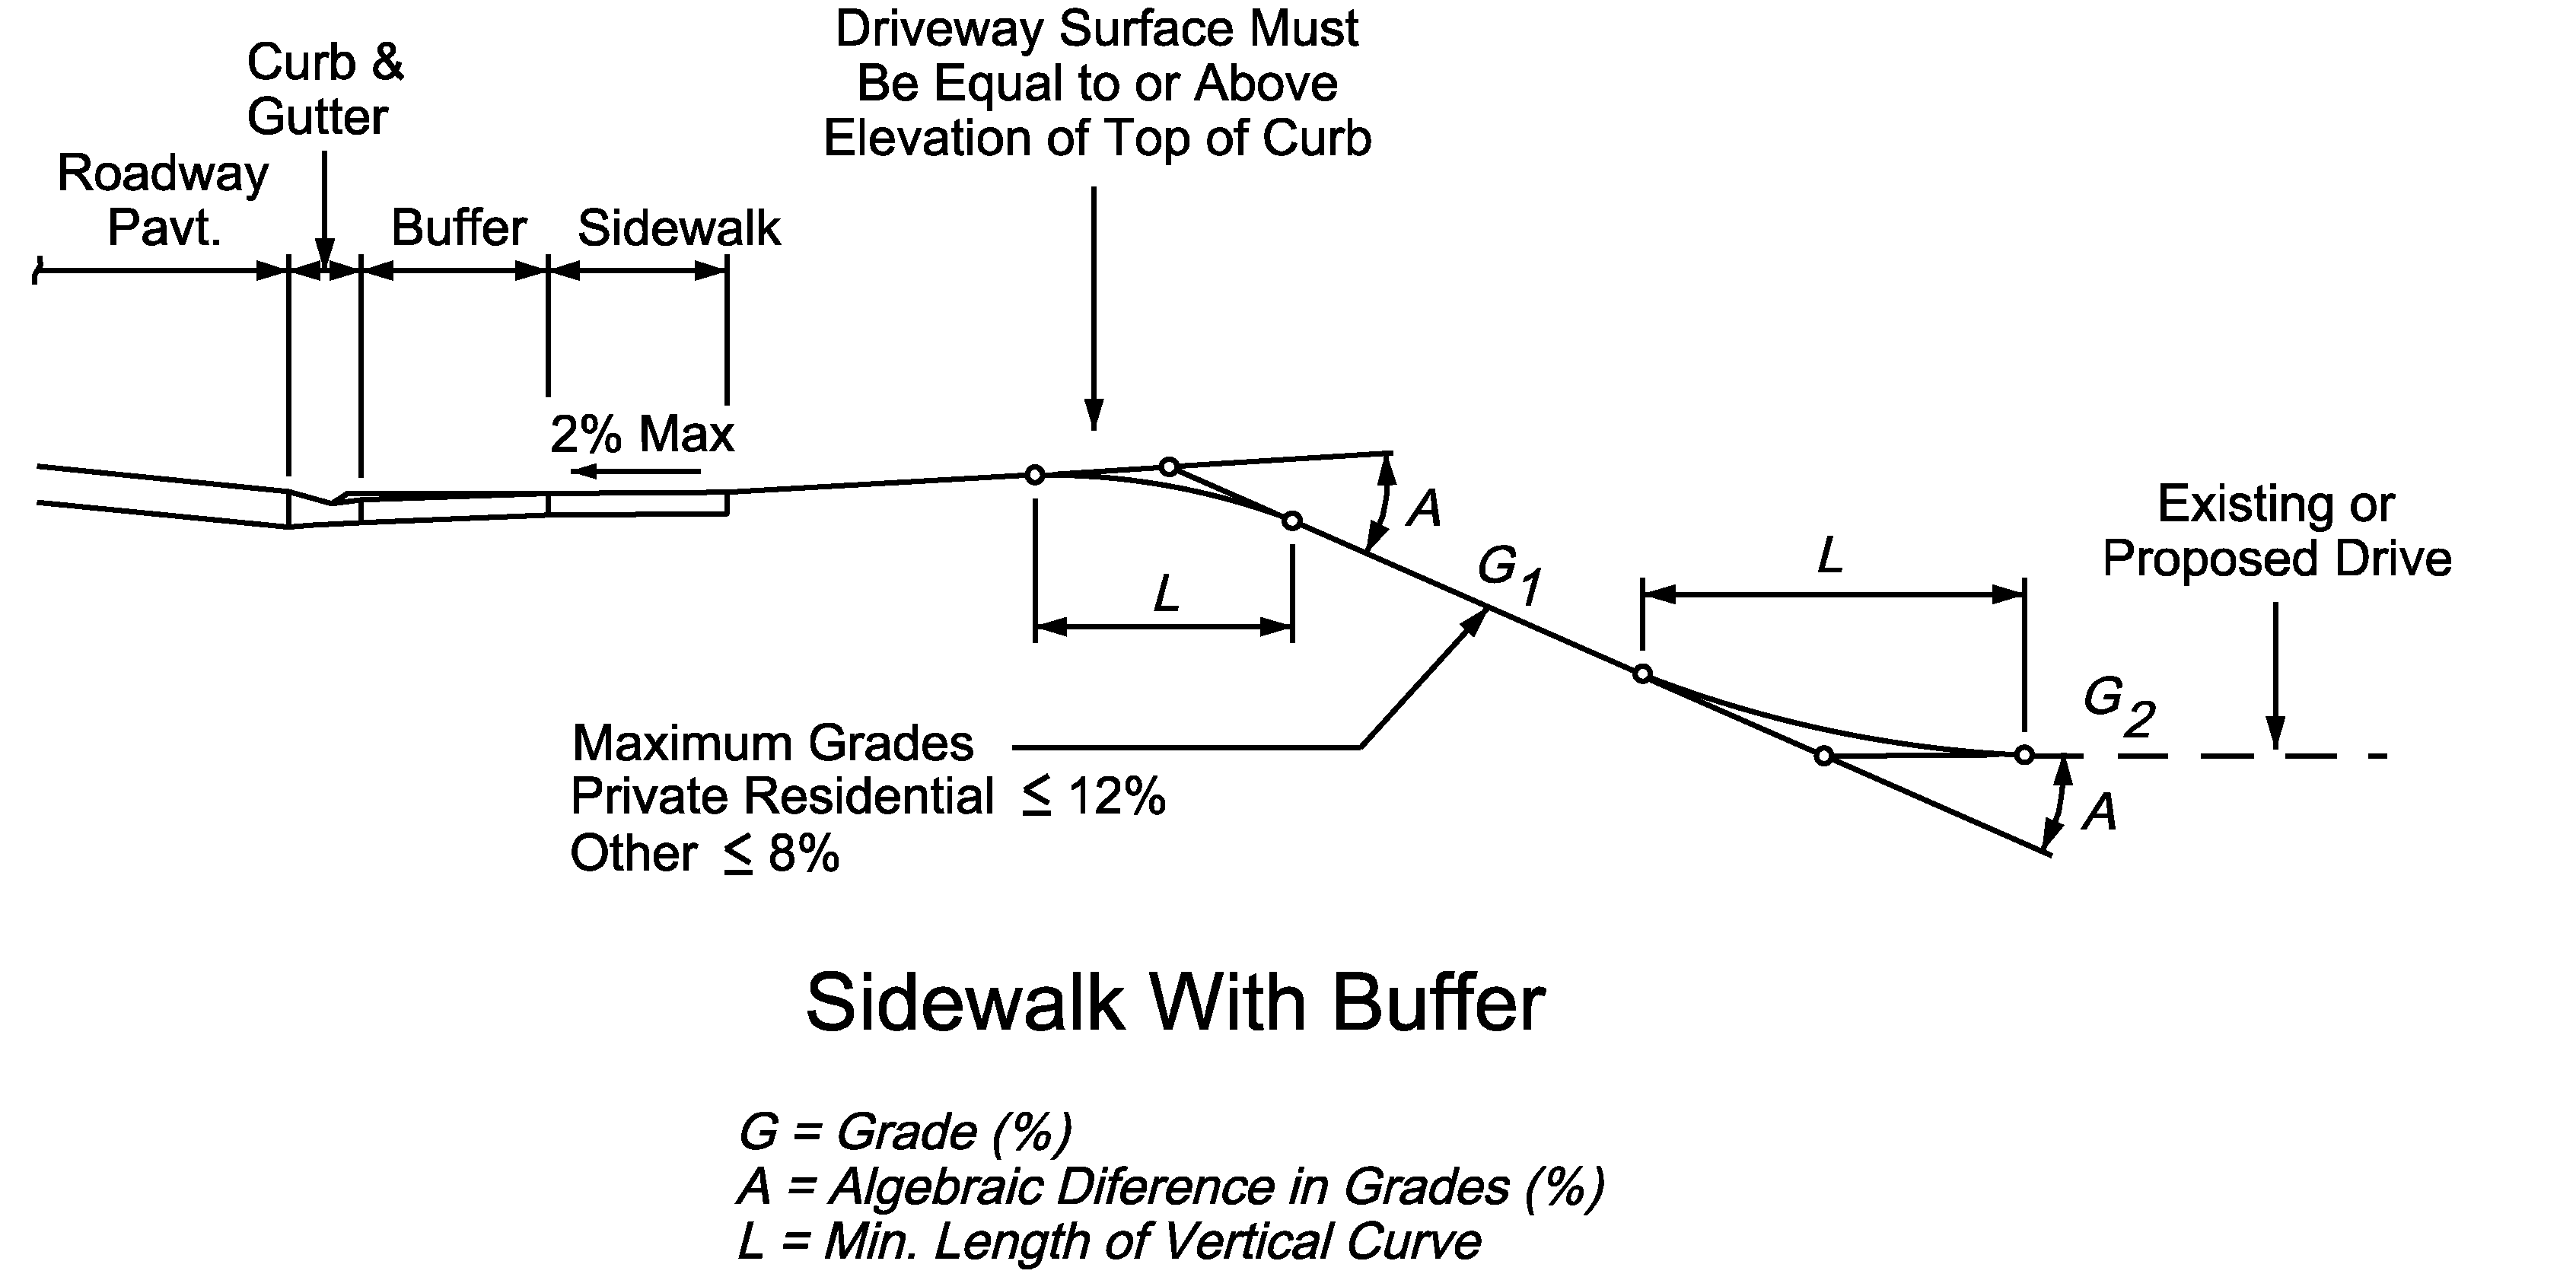
Figures C-9 through C-11 illustrate typical driveway profiles.
|
Change in Grade, A |
Crest |
Sag |
||
|---|---|---|---|---|
|
PrivateResidentialDriveways |
OtherDriveways |
PrivateResidentialDriveways |
OtherDriveways |
|
|
ft |
ft |
ft |
ft |
|
|
4-5% 6-7% 8-10% |
2 3 4 |
5 5 6 |
3 5 6 |
6 7 8 |
A minimum K-value of 4 (K = L/A) is recommended for driveways accommodating low ground clearance and / or long wheelbase vehicles (e.g., articulated beverage trucks, car haulers, and passenger car-trailer combinations).
Anchor: #i1007509Profiles on Curb and Gutter Sections
Figure C-9. Roadway with Curb and Gutter, Driveway Profiles on an Upgrade
Figure C-10. Roadway with Curb and Gutter, Driveway Profiles on a Downgrade
See Tables C-5 and C-6 for lengths of vertical curves.
Anchor: #i1007531Profiles with Drainage Ditch
Figure C-11. Driveway Profiles on Roadway with Drainage Ditch
See Tables C-5 and C-6 for lengths of vertical curves.


