Section 3: Developing Strip Maps
Anchor: #i1002483Strip Map Blanks
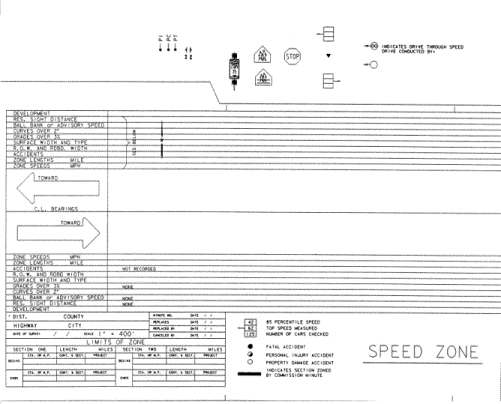
The first step in establishing a speed zone is the preparation of the strip map on which the data pertinent to the speed zone are recorded. The map should be drawn on a strip map blank. (These blanks are available from the Traffic Operations Division as a graphics file or as printed blanks.) Figure 3.3, Strip map blank (reduced in size), shows a sample strip map blank reduced in size. The blank is intended to ensure uniformity and reduce drafting work in the districts.
Anchor: #i1002497Scale for Strip Map
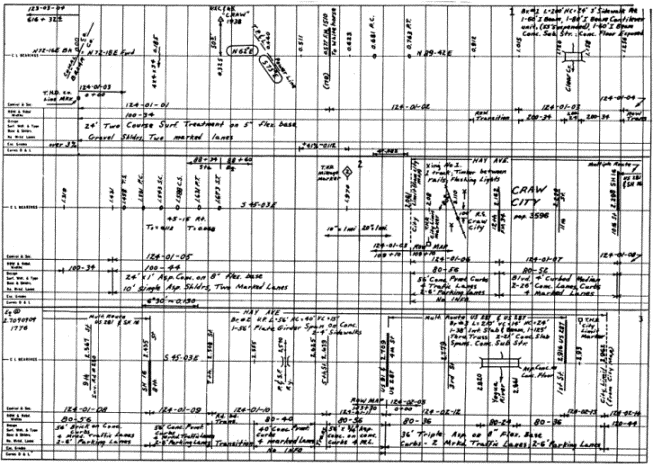
The scale used on the Road Inventory (RI-1) Highway Log Sheets is generally suitable for the strip map. In some cases, however, such as in highly developed areas, a scale of 1 inch = 300 feet is preferred. In sparsely developed rural areas, the RI-1 scale should be satisfactory. (See Figure 3.4, Typical road inventory data sheet (reduced in size), for example RI-1 sheet.)
Two different scales should not be used on the same strip map sheet. If, in zoning a long continuous section of highway, it is desirable to change the scale on the strip map, then another strip map sheet should be used for the beginning of the new scale.
Figure 3-3. Strip map blank (reduced in size)
NOTE: Click here to view or print the above graphic in MS Word.
Figure 3-4. Typical road inventory data sheet (reduced in size)
Anchor: #i1002541Field Entry Data
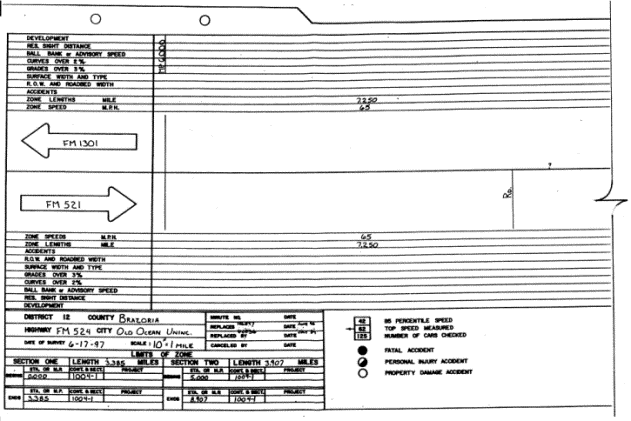
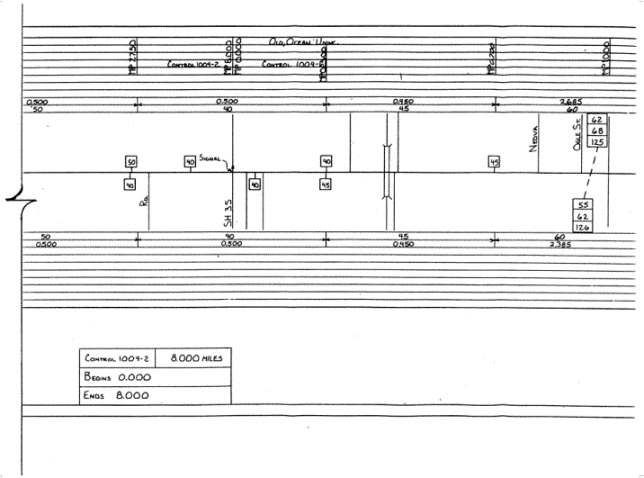
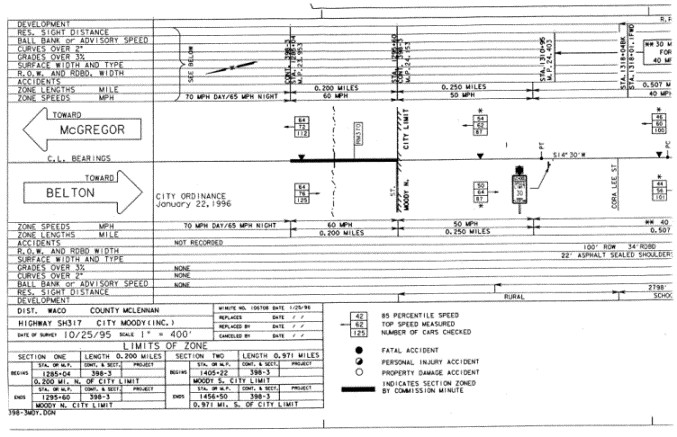
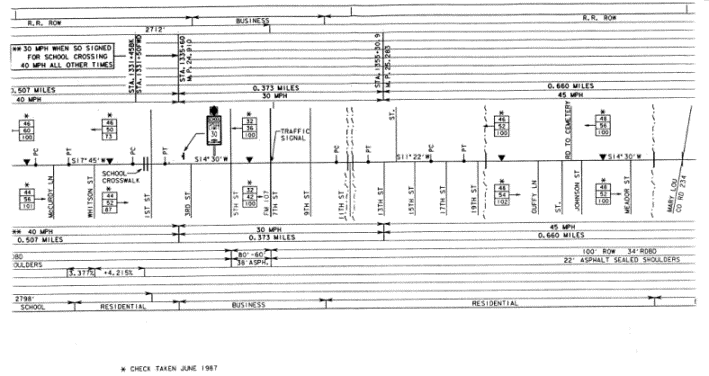
The strip map should be made complete by entering field data to show road details in every aspect. The headings on the strip map blank indicate much of the required data. Figure 3-5 through Figure 3-8 show examples of how the data should be presented.
If the roadway is not divided, it is not necessary to repeat the right-of-way and roadbed width, surface width and type, grades over three percent, and curves over two degrees for both directions of travel.
In addition to the headings on the strip map blank, the following information should be shown:
|
Information Item |
Notes |
|---|---|
|
Name and highway number of the route to be zoned |
|
|
Crossroads and cross streets |
|
|
Limits of the speed zone |
Indicate reference marker and milepoint and control and section numbers. Reference markers are generally in even two-mile increments, for example: 100, 102, 104. Speed zones or distances will be measured plus or minus from the reference marker. EXAMPLE: 102+1.343 |
|
Adjoining speed zone(s) of connecting map(s) |
- |
|
Limits of any incorporated city or town |
Show reference marker and milepoint and control and section numbers for these points. |
|
Names and approximate limits of the developed area of unincorporated towns |
Indicate by “beginning of developed area” and “end of developed area” under the heading, “Development” — not as “city limits.” |
|
Urban districts |
|
|
Schools and school crossings |
|
|
Traffic signals |
Show location of existing devices to aid in proper spacing and placement of speed zone signs. |
|
Important traffic generators |
Show all factories, shopping centers/malls, and any other establishments that attract large volumes of traffic. |
|
Ball bank readings |
Show each direction of travel for all curves having a safe speed of 10 miles per hour or more below the statewide maximum speed limit. |
|
Railroad crossings |
|
|
Bridges |
Indicate if the roadway on the bridge is narrower than the roadway on either side of it. |
Figure 3-5. Typical speed zone through an unincorporated community (continued in Figure 3.6)
NOTE: Click here to view or print the above graphic in MS Word.
Figure 3-6. (continued from Figure 3-5). Typical speed zone through an unincorporated community
Figure 3-7. Typical speed zone on approaches to and through an incorporated area (continued in Figure 3-8)
Figure 3-8. (continued from Figure 3-7). Typical speed zone on approaches to and through an incorporated area
Anchor: #i1002618City Limits
At locations where the study is extended into or through an incorporated city or town, the zone should be broken at the city limit, whether or not the zone speed changes. This is necessary because the speed limits inside the limits of an incorporated city or town may be established by the city government, while the speed limits outside the corporate limits of a city or town must be established by the Transportation Commission.
It is also necessary to show on the strip map the precise location of the city limit by milepoint and control section to prevent misinterpretation of the zone when the city limit is changed. The zone speed of any adjoining map should always be shown.
In the event the city limit is changed, the strip map and Transportation Commission minute order should be revised to show the new city limit.
Anchor: #CHDDIEFGSchools
If a reduced school speed limit is warranted, a speed zone strip map should be prepared as shown in Figure 3-7, Typical speed zone on approaches to and through an incorporated area (continued in Figure 3-8).
A regular speed zone must not change within the limits of a school speed zone, since posting of a regular SPEED ZONE sign at the point of change would prematurely terminate the school speed zone. This is due to the fact that speed limits remain fixed until a revised limit is encountered.
Speed checks provide a sound basis for selecting the proper speed limits for school zones. While it is not common practice to set speed limits significantly lower than the 85th percentile speed for regulatory speed zones, exceptions to this practice are often found at school zones.
Factual studies, reason, and sound engineering judgment, rather than emotion, should govern the final decision on the maximum deviation from the 85th percentile speed which will provide a reasonable and prudent speed limit.
It is not advisable to set a school speed limit above 35 miles per hour in either rural or urban areas. Lower school speed limits should be considered when the 85th percentile speed is below 50 miles per hour.
When the results of a speed study indicate an 85th percentile speed at or below 50 miles per hour, the reduced school speed limit should not be more than 15 miles per hour below the 85th percentile speed or normal posted speed limits. If the 85th percentile speed is 55 miles per hour, the reduced school speed limit should be 20 miles per hour below the 85th percentile speed. Any roadway with an 85th percentile speed greater than 55 miles per hour requires a buffer zone to transition down to a 35-mph speed limit.
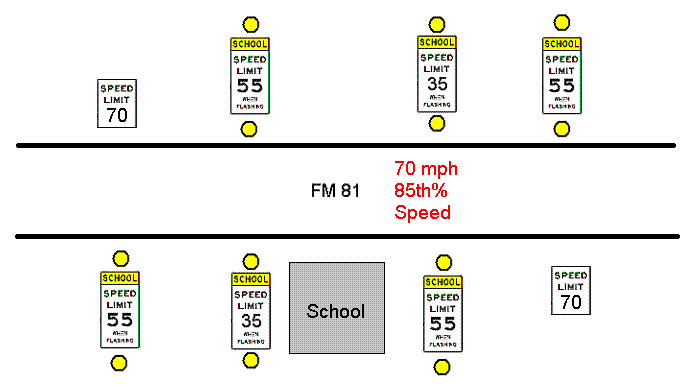
Operation of Buffer Zones. In some cases it may be appropriate to operate the buffer zone during the same time periods as the school speed zone. This will allow motorists to travel at the higher posted speeds through both zones when the slower speeds are not necessary. An example of this would be a highway with a regular posted speed limit of 70 mph and a posted school zone speed limit of 35 mph. In this case it would be appropriate to have a school transition speed zone of 55 mph that flashes on the approach and departure side of the 35-mph school zone (see Figure 3-9). This design promotes better public relations, because people are not encouraged to violate or disrespect the law when driving through permanent transition zones that are in effect 24 hours a day. Other situations may not lend themselves to such transition zones and, therefore, should be left up to engineering judgment. The basic sign design for a school transition speed zone sign is the same as that for a regular school speed limit sign. Where TxDOT is responsible for signing school speed zones and school transition speed zones, the SCHOOL SPEED LIMIT XX WHEN FLASHING sign should be used.
Figure 3-9. Typical school zone with flashing buffer zone
Anchor: #i1002690Showing Crashes on Strip Maps
At locations where recommended speed zones will be 5 miles per hour or more below the 85th percentile speed because of high crash experience, the crashes for the most recent calendar year available should be shown on the strip map. RI-1 Sheets will facilitate accurate plotting of crashes, since crash locations are coded from these sheets.
When districts submit strip maps or prints to the Traffic Operations Division (TRF) for review, TRF will obtain the crash rate for the roadway section in question as well as the statewide average crash rate for the appropriate type of roadway section and add these data to the strip map. Crash rates will be considered before lowering the zone. These data will be an important consideration in determining whether the lower zoning is justified.
Crash data need not be plotted on the strip map when proposed speed zones are within 5 miles per hour of the 85th percentile speed checks.
