Section 3: Non-Destructive Evaluation of Pavement Functional Properties
Anchor: #i10090693.1 Introduction
Non-destructive testing is used to test functional and structural properties of the pavement. This section discusses the use of non-destructive testing to evaluate the functional properties and the next section discusses its use for structural properties. Functional properties routinely evaluated include:
- Anchor: #PKIMTUGP
- roughness, and Anchor: #EIEPVPRC
- skid resistance.
3.2 Roughness
Roughness is the absence or lack of smoothness in the longitudinal or transverse profile of the highway surface, resulting in poor ride quality. Roughness can be generated by localized surface or subsurface distress, poor construction quality (compaction, grade control, poor bonding of the surface HMA layer to the underlying HMA layer, etc.), or shrink-swell activity in the subgrade or fill soils. Proper diagnosis of the source of roughness must be made to insure that any corrective action addresses the source of the problem and will perform to expectations.
Pavements should begin their life (new or post-rehabilitation/reconstruction) in as smooth a condition as practical. Roughness begets additional roughness – more severe dynamic traffic loads are incurred which will accelerate deterioration at the weakest locations. As roughness increases, so do user costs and potential safety problems.
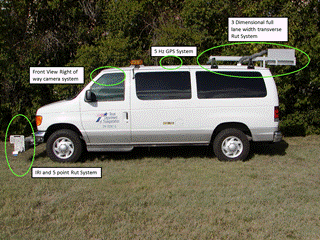
Longitudinal and transverse roughness statistics are measured by the profiler/rut bar vehicle at highway speeds. Scheduling is arranged through the Pavement Evaluation office (Pavement Preservation, MNT) at (512) 832-7210. For the longitudinal direction, the profiler uses a combination of two lasers, two accelerometers, and a distance signal to measure the inertial profile of each wheel path. Measurements are processed on board to compute serviceability index (SI) and the International Roughness Index (IRI). The SI scale of measurement is 0.1 – 5.0 with an SI of 5.0 being perfectly smooth. The IRI units are in./mi. with summary statistics every 0.1 mi. For more information, refer to The Little Book of Profiling and Chapter 11 of this manual.
Transverse profile is evaluated in terms of rut depth and is measured by an 8-ft. wide van-mounted rut bar with ultrasonic sensors that measure the distance from the bar to the pavement surface at five locations across the lane. Sensors are located in each wheel path, between the wheel path and 18 in. outside of the wheel paths. Average rut depth is computed on board with summary statistics every 0.1 mi.
Figure 4-1. Profiler/rut bar vehicle.
Anchor: #i10046003.3 Skid Resistance
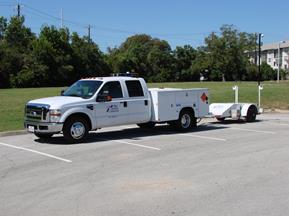
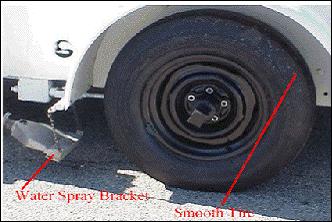
Skid resistance is the force developed when a tire that is prevented from rotating slides along the pavement surface. It is a function of the micro and macro texture of the pavement surface. An index value is assigned (skid score) based on measurements taken with a locked-wheel skid trailer towed behind a specially designed truck. The trailer administers a water spray to the pavement in front of the left tire. Smooth-treaded trailer tires are used. Testing is accomplished at 50 mph by locking the trailer’s left wheel at periodic intervals while a metered amount of water is sprayed on the pavement surface. Scores generally range from 10 to 40, with the higher number indicating greater skid resistance. These systems are scheduled through the Pavement Evaluation office (Pavement Preservation, MNT) at (512) 832-7210.
Figure 4-2. Skid truck.
Figure 4-3. Detail of skid trailer.


