Section 5: Channel Analysis Guidelines
Anchor: #i1018481Stage-Discharge Relationship
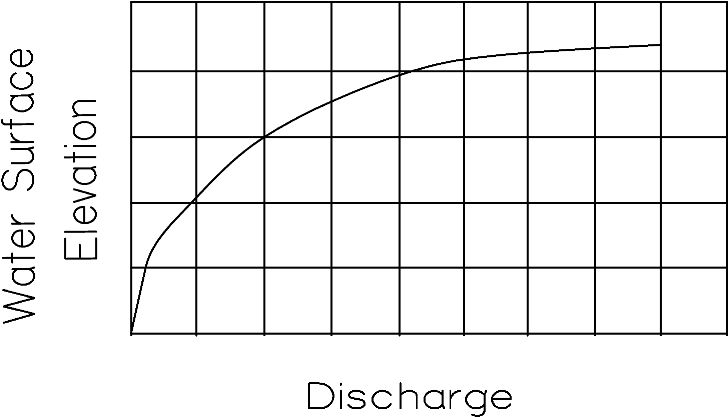
A stage-discharge curve is a graph of water surface elevation versus flow rate in a channel. A stage-discharge curve is shown in Figure 7‑12. You may compute various depths of the total discharge for the stream, normal flow channel, and floodplain.
Figure 7-12. Typical Stage Discharge Curve
(See Manning’s Equation for Uniform Flow and Stage-Discharge Determination.) The data, plotted in graphic form (sometimes termed a “rating curve”), gives you a visual display of the relationship between water surface elevations and discharges.
An accurate stage-discharge relationship is necessary for channel design to evaluate the interrelationships of flow characteristics and to establish alternatives for width, depth of flow, freeboard, conveyance capacity and type, and required degree of stabilization.
The stage-discharge relationship also enables you to evaluate a range of conditions as opposed to a preselected design flow rate.
Examine the plot of stage-discharge carefully for evidence of the “switchback” characteristic described below. Also, examine the plot to determine whether or not it is realistic. For example, a stream serving a small watershed should reflect reasonable discharge rates for apparent high water elevations.
Anchor: #i1018525Switchback
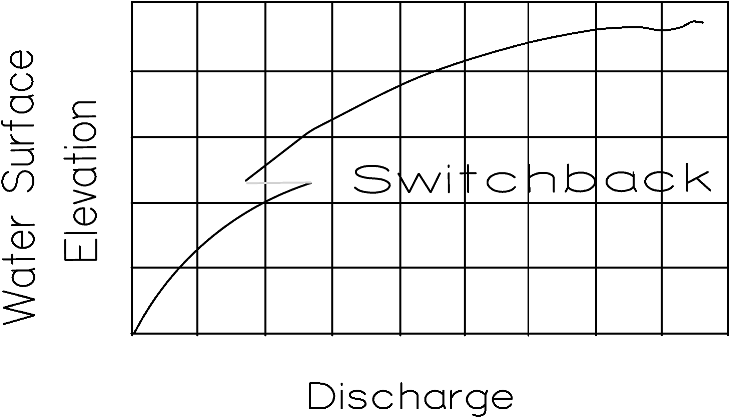
If you improperly subdivide the cross section, the mathematics of Manning’s Equation may cause a switchback. A switchback results when the calculated discharge decreases with an associated increase in elevation or depth (see Manning’s Equation for Uniform Flow in Chapter 6, Equation 6-3 and Figure 7‑13). A small increase in depth can result in a small increase in cross-sectional area and large increase in wetted perimeter and a net decrease in the hydraulic radius. The discharge computed using the smaller hydraulic radius and the slightly larger cross-sectional area is lower than the previous discharge for which the water depth was lower. Use more subdivisions within such cross sections in order to avoid the switchback.
Figure 7-13. Switchback in Stage Discharge Curve
A switchback can occur in any type of conveyance computation. Computer logic can be seriously confused if a switchback occurs in any cross section being used in a program. For this reason, always subdivide the cross section with respect to both roughness and geometric changes. Note that the actual n-value may be the same in adjacent subsections. However, too many subdivisions can result in problems, too. (See Chapter 6 for more information.)

