Section 9: Statistical Analysis of Stream Gauge Data
If the gauging record covers a sufficient period of time, it is possible to develop a flow-frequency relation by statistical analysis of the series of recorded annual maximum flows. The designer can then use the flow-frequency relation in one of two ways:
- Anchor: #JMHEHHFF
- If the facility site is near the gauging station on the same stream and watershed, the designer can directly use the discharge obtained from the flow-frequency relation for the design AEP. Anchor: #QLEKKKHE
- If the facility site is on the same stream, but not proximate to the gauging station, it may be possible to transpose gauge analysis results.
Widely accepted and applied guidelines for statistical analyses of stream gauge data are published in Guidelines for Determining Flood Flow Frequency, Bulletin #17C (USGS 2018). Procedures from Bulletin #17C, with some Texas-specific refinements, as outlined in this manual, are recommended. They include:
- Anchor: #NLKKHGKJ
- Obtaining a sufficiently large sample of streamflow data for statistical analysis, Anchor: #OLJNFIJI
- Using the log-Pearson type III distribution fitting procedure, Anchor: #ITIFKJMH
- Using a weighted skew value, Anchor: #FHJLELNK
- Accommodating outliers, Anchor: #MLMMGMHG
- Transposing gauge analysis results, if necessary and appropriate.
Software most commonly used to perform these analyses in Texas are PeakFQ by USGS and HEC-SSP by USACE.
Anchor: #i1105339Data Requirements for Statistical Analysis
The greatest challenge in applying the statistical analysis of stream gauge data is obtaining a sufficiently large sample of streamflow measurements (or estimates) so that the sample is representative of the entire population of flows. Three types of data may be considered (USGS 2018), systematic data, historical data, and paleoflood and botanical information.
Systematic data are flow records generated from a defined set of rules and recorded on a regular basis. For example, the United States Geological Survey (USGS) annual maximum flow record for a gauge consists of the maximum instantaneous flow value for each year, recorded every year over a given time period. If annual maximum flow values were recorded only for years in which large events occurred, then the record would no longer be systematic. Gaps (missing years) in the systematic record do not preclude use of such data so long as the gaps are the result of missing data, and not the result of filtering the data based on flow magnitude.
Historical data are flow estimates for events not included in the systematic record. These data typically consist of historically significant events, and thus are a sample of extreme events observed by locals. Historical data should be included in the analysis when possible. In cases where only a short systematic record is available, historical data are particularly valuable. Use of historical data also ensures that the results of the analysis will be consistent with the experience of the local community (USGS 2018). Bulletin 17C incorporates new procedures on how to better include historical data in the analysis.
Paleoflood and botanical information can also be part of a statistical stream gauge analysis. Paleofloods are different from historical floods in that they are determined by geologic and physical evidence of past floods rather than human records or referenced from built infrastructure. Geomorphic surfaces, like terraces adjacent to rivers, can be used to place limits on flood discharges to estimate nonexceedance bounds. Paleoflood data are treated similarly to historical flood data for flood frequency analysis. Botanical information consists of vegetation that records evidence of flood(s) or stability of a geomorphic surface over time. Examples include corrasion scars, adventitious sprouts, tree age, and tree ring anomalies. For flood frequency analysis, it is common to describe botanical information as binomial-censored observations. Bulletin 17C includes guidance on how to incorporate this information.
For highway drainage design purposes, a statistical analysis of stream gauge data is typically applied only when adequate data from stream gauging stations are available. The definition of adequate data comes from USGS practice and is provided in Table 4-3.
|
Desired percent chance exceedance (ARI) |
Minimum record length (years) |
|---|---|
|
10-year |
8 |
|
25-year |
10 |
|
50-year |
15 |
|
100-year |
20 |
For TxDOT application, sources for annual peak flow data include:
- Anchor: #IMOGFGFL
- USGS National Water Information System (NWIS). Anchor: #PEHILHEI
- US Department of the Interior, USGS Water Resources Data - Texas, Surface Water. These are prepared annually and contain records for 1 water year per publication. As a result, abstracting annual peaks for a long record is time consuming. Anchor: #LHUKKMEH
- International Boundary and Water Commission water bulletins. Anchor: #VKWDCWGW
- River authority and municipal sources such as Lower Colorado River Authority (LCRA) Hydromet.
If the available data sources allow the designer to construct a sufficiently large sample of annual peak streamflow values, then the following conditions must also be satisfied or accounted for before undertaking the statistical analysis:
- Anchor: #HPNLGKKJ
- The data must be representative of the design condition of the watershed. Anchor: #LKNFKLIH
- The data must not be significantly affected by upstream regulation (such as, dams, reservoirs, and diversions). Anchor: #KKJMNHFK
- The systematic record must be stationary, with no general trend of increasing or decreasing flows resulting from changes to the watershed. Anchor: #LLEMLEHE
- The data must be homogeneous, with flow values resulting from the same types of events. If annual peak flows can result from either rainfall or snowmelt, then a mixed population analysis may be required. Anchor: #MKTFJFGN
- Errors in flow measurements must not be significant relative to other uncertainties in the analysis.
Log-Pearson Type III Distribution Fitting Procedure
The log-Pearson type III (LPIII) statistical distribution method is recommended in Bulletin #17C and is the standard of practice for estimating annual probability of exceedance of peak flows. An outline of this method follows. However, the designer is not limited to using this method, especially if the resulting flow-frequency relation does not seem to fit the data.
The following general procedure is used for LPIII analyses. The LPIII, Skew, and Accommodation of Outliers procedures described below are still based on information from Bulletin #17B. The latest HDM update occurred soon after the release of #17C and during ongoing TxDOT research on updating skew procedures. Recent edits in this section simply introduce Bulletin #17C. A future HDM version will update these sections to reflect latest #17C procedures. Meanwhile, refer to Bulletin #17C for further information.
- Anchor: #GGNKFLFG
- Acquire and assess the annual peak discharge record. Anchor: #PIHKNJLE
- Compute the base 10 logarithm of each discharge value. Anchor: #NOJLLLIG
- Compute the mean, standard deviation, and (station) skew of the log flow values. Anchor: #MNLFMJGM
- Compute the weighted skew coefficient from the station skew and regional skew. Anchor: #MKEENEHJ
- Identify high and low outliers from the sample set. Anchor: #GKONINJL
- Recompute the mean, standard deviation, and station skew of the log flow values with outliers removed from the sample set. Anchor: #LPMEMLMK
- Compute flow values for desired AEPs.
With the LPIII method, the logarithm of the discharge for any AEP is calculated as:
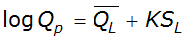
Equation 4-2.
Where:
- Anchor: #GHUEKFHN
 = mean of the logarithms of the annual
peak discharges
Anchor: #JOGHIENF
= mean of the logarithms of the annual
peak discharges
Anchor: #JOGHIENF- Qp = flood magnitude (cfs or m3/s) of AEP p Anchor: #LKNLGJFI
- K = frequency factor for AEP p and coefficient of skew appropriate for site Anchor: #TGGNIILK
- SL = standard of deviation of logarithms of the annual peak discharges
See the spreadsheet freqfrac.xls for values of K, based on station skew coefficient.
The three statistical moments used to describe the LPIII distribution are the mean, standard deviation, and skew. Estimates of these moments for the distribution of the entire population of flows are computed for the available sample of flows with the equations below.
The mean is given by:
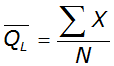
Equation 4-3.
Where:
- Anchor: #MPHGNJJN
 = mean of the (base 10) logarithms of the annual
peak discharges
Anchor: #HLEMKHGM
= mean of the (base 10) logarithms of the annual
peak discharges
Anchor: #HLEMKHGM- X = logarithm of the annual peak discharge Anchor: #JMNLNFLF
- N = number of observations
The standard deviation is given by:
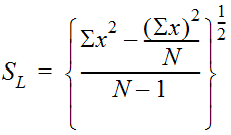
Equation 4-4.
Where:
- Anchor: #ENNNJGHM
- SL = standard deviation of the logarithms of the annual peak discharge; N and X are defined as above
The coefficient of skew (station skew) is given by:
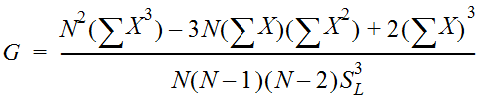
Equation 4-5.
Where:
- Anchor: #QMGNMIFF
- G = coefficient of skew of log values; N, X, and SL are defined as above
Skew represents the degree of curvature to the flow-frequency curve as shown in Figure 4-3. In Figure 4-3 the X-axis scale is probability (symmetric at about AEP = 0.5) and the Y-axis scale is base 10 logarithmic flow. A skew of zero results in a straight-line flow frequency curve. A negative skew value produces a flow-frequency curve with lesser flows than the zero skew line, and a positive skew produces a flow-frequency curve with greater flows than the zero skew line.
")
Figure 4-3. Skew of discharge versus frequency plots
The following cases require special consideration. Bulletin #17C provides further guidance:
- Anchor: #LIJHHFMN
- Record is incomplete—flows missing from record because they were too small or too large to measure (flows filtered from record based on flow magnitude). Anchor: #MEEFJMMF
- Record contains zero flow values—stream was dry all year. Anchor: #LKHLFGGM
- Record contains historical flows not recorded in a systematic fashion. Examples are extreme events recorded prior to or after installation of a stream gauge. These are indicated by code in USGS annual peak discharge data. Anchor: #OKFNFHHH
- Flows are the result of two distinct types (a mixed population) of hydrologic events such as snowmelt and rainstorms.
Skew
Bulletin #17B recommends using the weighted skew value, GW, to determine frequency factor values in Equation 4-2.
To calculate weighted skew, use this equation, and follow the steps provided in Bulletin #17B:
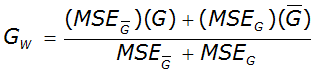
Equation 4-6.
Where:
- Anchor: #LOTIHEFL
- GW = weighted skew value Anchor: #MHHGGMGN
 = regional
skew from Figure 4-4
Anchor: #LHIJJLLH
= regional
skew from Figure 4-4
Anchor: #LHIJJLLH- G = station skew from Equation 4-5 Anchor: #TIHJEFHH
 = mean
square error of
= mean
square error of  for
Texas, is = 0.123 (RMSE = 0.35) (Judd et al. 1996), which replaces
the value of 0.302 (RMSE = 0.55) presented in Bulletin #17B.
Anchor: #EOQEKIME
for
Texas, is = 0.123 (RMSE = 0.35) (Judd et al. 1996), which replaces
the value of 0.302 (RMSE = 0.55) presented in Bulletin #17B.
Anchor: #EOQEKIME- MSEG = mean square error of G. MSEG is a function of G and period of record
 () (click in image to see full-size image)")
Figure 4-4. Generalized skew coefficients for Texas
(Judd 1996) ( )
)

Equation 4-7.
Where N is the record of length and
- Anchor: #IUSMLHPT
- A = -0.33 + 0.08 |G| for |G| < 0.90 Anchor: #IOMEDGXN
- A = -0.52 + 0.30 |G| for |G| > 0.90
And
- Anchor: #NJYSJDAF
- B = 0.94 - 0.26 |G| for |G| < 1.50 Anchor: #WTNXRMCW
- B = 0.55 for |G| > 1.50
Accommodation of Outliers
The distribution of all the annual and historical peak discharges determines the shape of the flow-frequency curve and thus the design-peak discharges. The shape of the frequency curve generated by a log-Pearson type III analysis is symmetrical about the center of the curve. Therefore, the distribution of the higher peak discharges affects the shape of the curve, as does the distribution of the lower peak discharges.
Flooding is erratic in Texas, so a series of observed floods may include annual peak discharge rates that do not seem to belong to the population of the series. The values may be extremely large or extremely small with respect to the rest of the series of observations. Such values may be outliers that should be excluded from the set of data to be analyzed or treated as historical data. Bulletin #17C calls for identification of these outliers.
Design flows are typically infrequent large flows. Therefore, it is desirable to base the frequency curve on the distribution of the larger peaks. This is accomplished by eliminating from the analyses peak discharges lower than a low-outlier threshold. The value for the low-outlier threshold, therefore, should exclude those peaks not indicative of the distribution for the higher peaks. This value is chosen by reviewing the sequentially ranked values for all peak discharges used in the analysis.
Equation 4-8 provides a means of identifying the low outlier threshold (Asquith et. al 1995):
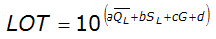
Equation 4-8.
Where:
- Anchor: #IJQLEHIL
- LOT = estimated low-outlier threshold (cfs) Anchor: #FIMEGGLN
 = mean
of the logarithms of the annual peak discharge (see Equation 4-3)
Anchor: #MFQKNLMK
= mean
of the logarithms of the annual peak discharge (see Equation 4-3)
Anchor: #MFQKNLMK- SL = standard deviation of the logarithms of the annual peak discharge (see Equation 4-4) Anchor: #HKMIIIEM
- G = coefficient of skew of log values (station skew, see Equation 4-5) Anchor: #OTJGNLKF
- a = 1.09 Anchor: #EKKIFILI
- b = -0.584 Anchor: #FHNIGFMM
- c = 0.140 Anchor: #MLJELHHL
- d = -0.799
This equation was developed for English units only and does not currently have a metric equivalent.
High outlier thresholds permit identification of extremely high peak discharges with probability smaller than indicated by the period of record for a station. For example, if a true 1% percent chance exceedance (100-year) peak discharge were gauged during a 10-year period of record, the frequency curve computed from the 10 years of record would be unduly shaped by the 1% percent chance exceedance peak.
The USGS has made efforts to identify high outliers, referred to as historical peaks, by identifying and interviewing residents living proximate to the gauging stations. In many cases, residents have identified a particular flood peak as being the highest since a previous higher peak. These peaks are identified as the highest since a specific date.
In other cases, residents have identified a specific peak as the highest since they have lived proximate to the gauging station. Those peaks are identified as the highest since at least a specific date. The historical peaks may precede or be within the period of gauged record for the station.
Equation 4-9 provides a means of identifying the high outlier threshold (Bulletin #17B):
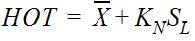
Equation 4-9.
Where:
- Anchor: #OQFNLEGI
- HOT = estimated high-outlier threshold (logarithm of flow) Anchor: #GIMNJNLM
- N = number of systematic peaks remaining in sample after previously detected outliers have been removed Anchor: #IFGGKKLJ
 = mean
of the logarithms of the systematic annual peak discharges, with
previously detected outliers removed
Anchor: #OJJKFKIJ
= mean
of the logarithms of the systematic annual peak discharges, with
previously detected outliers removed
Anchor: #OJJKFKIJ- SL = standard of deviation of the logarithms of the annual peak discharges Anchor: #HLHGEFJE
- KN = frequency factor for sample size N from Appendix 4 of Bulletin #17B
All known historical peak discharges and their associated gauge heights and dates appear on the USGS Texas Water Science web site.
To incorporate high outlier information when fitting the LPIII distribution according to Bulletin #17B procedures, the designer will:
- Anchor: #FRHNKGLL
- Use Equation 4-9 to define the high-outlier threshold. Anchor: #OIHENIHJ
- Collect supporting information about the identified high outlying flows. Anchor: #EGJHIHNE
- Retain as part of the systematic record any high outlying flows found not to be the maximum flow of record. Anchor: #HKJINNLG
- Extend the period of record for the analysis to include the flow if the flow’s value is found to be the maximum flow of record and lies outside the systematic record. If the value does lie within the systematic record, the period of record is not extended. In both cases, the designer shall recompute the LPIII parameters following the procedure described in Section V.A.9 and Appendix 6 of Bulletin #17B. Anchor: #OOIMIKFJ
- Thoroughly document data, interviews, decisions, and assumptions used to justify the identification of high outliers and recomputation of LPIII parameters.
TxDOT recommends the use of hydrologic statistical analysis computer programs that can detect outlying values and recomputed LPIII parameters consistent with Bulletin #17C procedures.
Anchor: #i1106111Transposition of Gauge Analysis Results
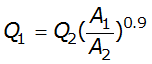
If gauge data are not available at the design location, discharge values can be estimated by transposition if a peak flow-frequency curve is available at a nearby gauged location. This method is appropriate for hydrologically similar watersheds that differ in area by less than 50 percent, with outlet locations less than 100 miles apart.
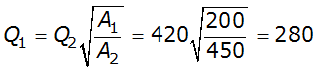
From the research of Asquith and Thompson 2008, an estimate of the desired AEP peak flow at the ungauged site is provided by Equation 4-10:
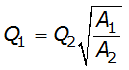
Equation 4-10.
Where:
- Anchor: #HIFIIJGH
- Q1 = Estimated AEP discharge at ungauged watershed 1 Anchor: #KQFJGJGM
- Q2 = Known AEP discharge at gauged watershed 2 Anchor: #HJNHILNG
- A1 = Area of watershed 1 Anchor: #NNINGLJJ
- A2 = Area of watershed 2
Transposition of peak flow is demonstrated with the following example. A designer requires an estimate of the 1% AEP streamflow at an ungauged location with drainage area of 200 square miles. A nearby (within 100 miles) stream gauge has a hydrologically similar drainage area of 450 square miles. The 1% AEP peak streamflow at the gauged location is 420 cfs based on the peak flow-frequency curve developed for that location. Substituting into Equation 4-10 results in 280 cfs as an estimate of the 1% AEP peak discharge at the ungauged location:
If flow-frequency curves are available at multiple gauged sites, Equation 4-10 can be used to estimate the desired peak AEP flow from each site. Then, with judgment and knowledge of the watersheds, those estimates could be weighted to provide an estimate of the desired AEP flow at the ungauged location. This process should be well documented.
Design of a storage facility, such as a detention pond, may require estimates of AEP flows for longer durations. If a flow-frequency curve for longer flow duration is available at a nearby gauged location, then Equation 4-11, based on an analysis of mean-daily flows (Asquith et al. 2006), may be used for transposition:
Equation 4-11.