Section 2: Introduction and Applicability
Anchor: #i1025101Purpose
This chapter describes the requirements for coastal hydraulic design studies performed for the Texas Department of Transportation (TxDOT). Its purpose is to guide Departmental staff and consultants performing design work in a coastal area and introduce the reader to general coastal engineering concepts. This chapter is not intended to be a detailed design guide but rather provides references for data sources and industry-standard coastal engineering guidance to assist design.
Anchor: #i1025111Applicable Projects
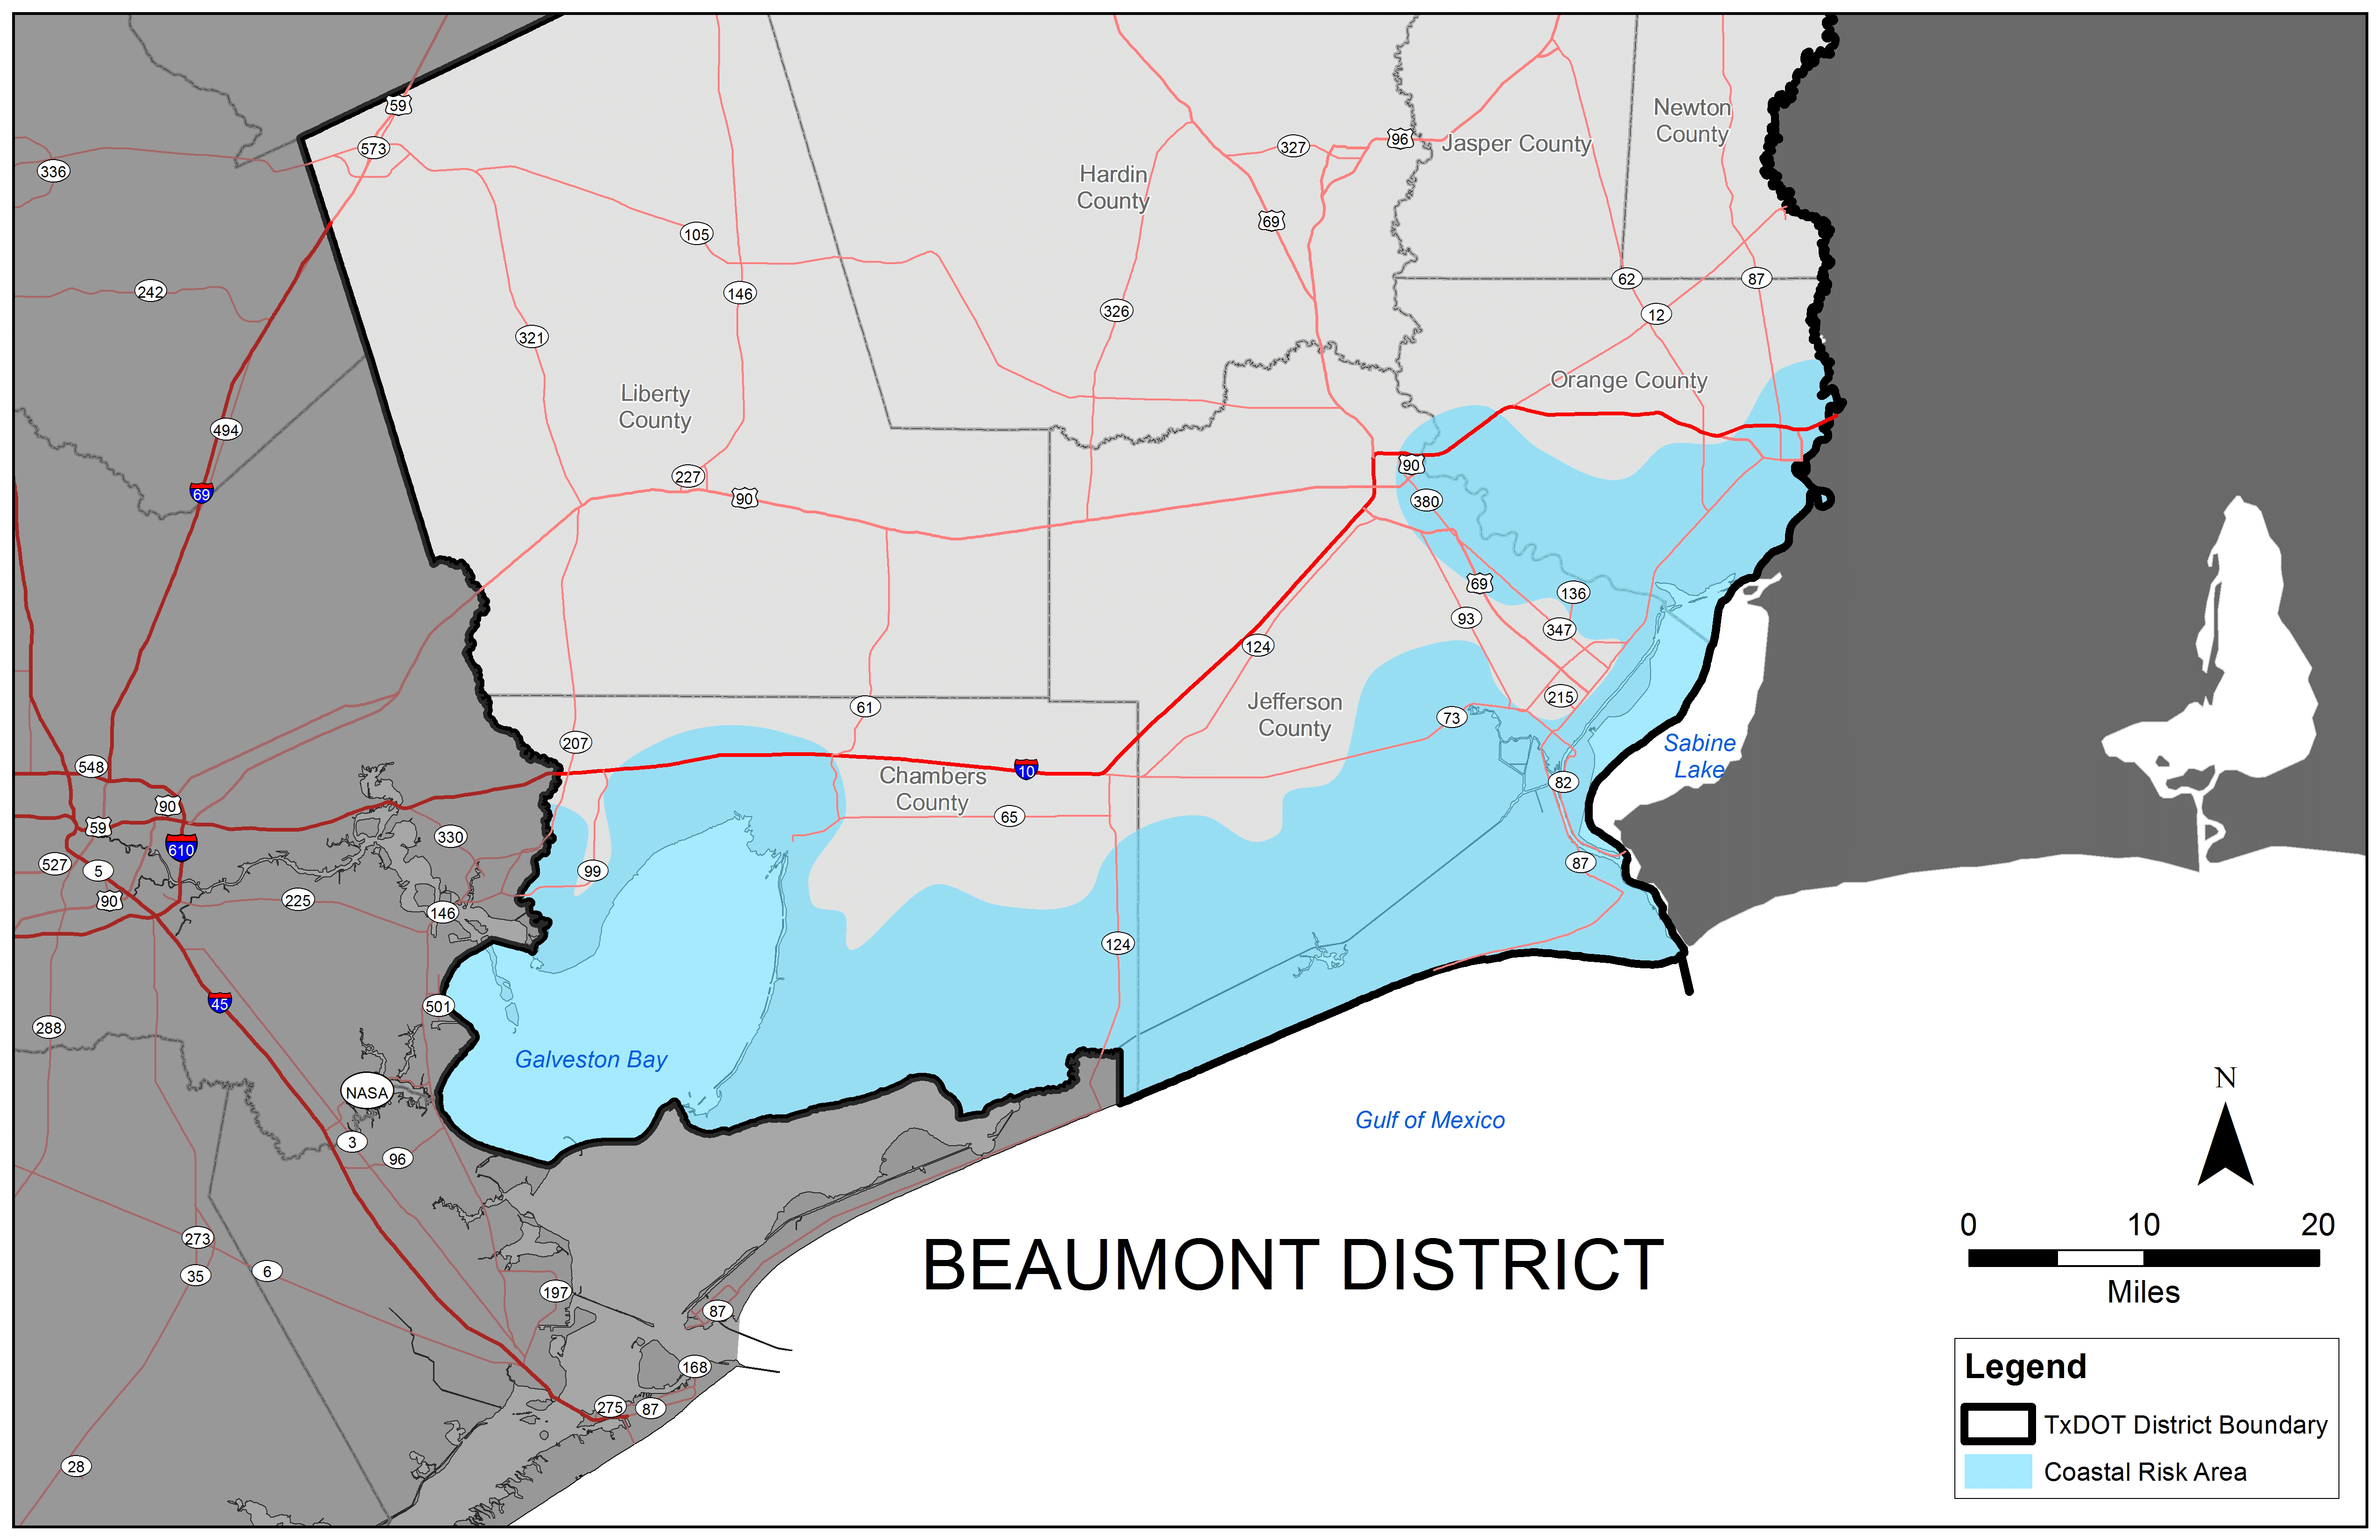
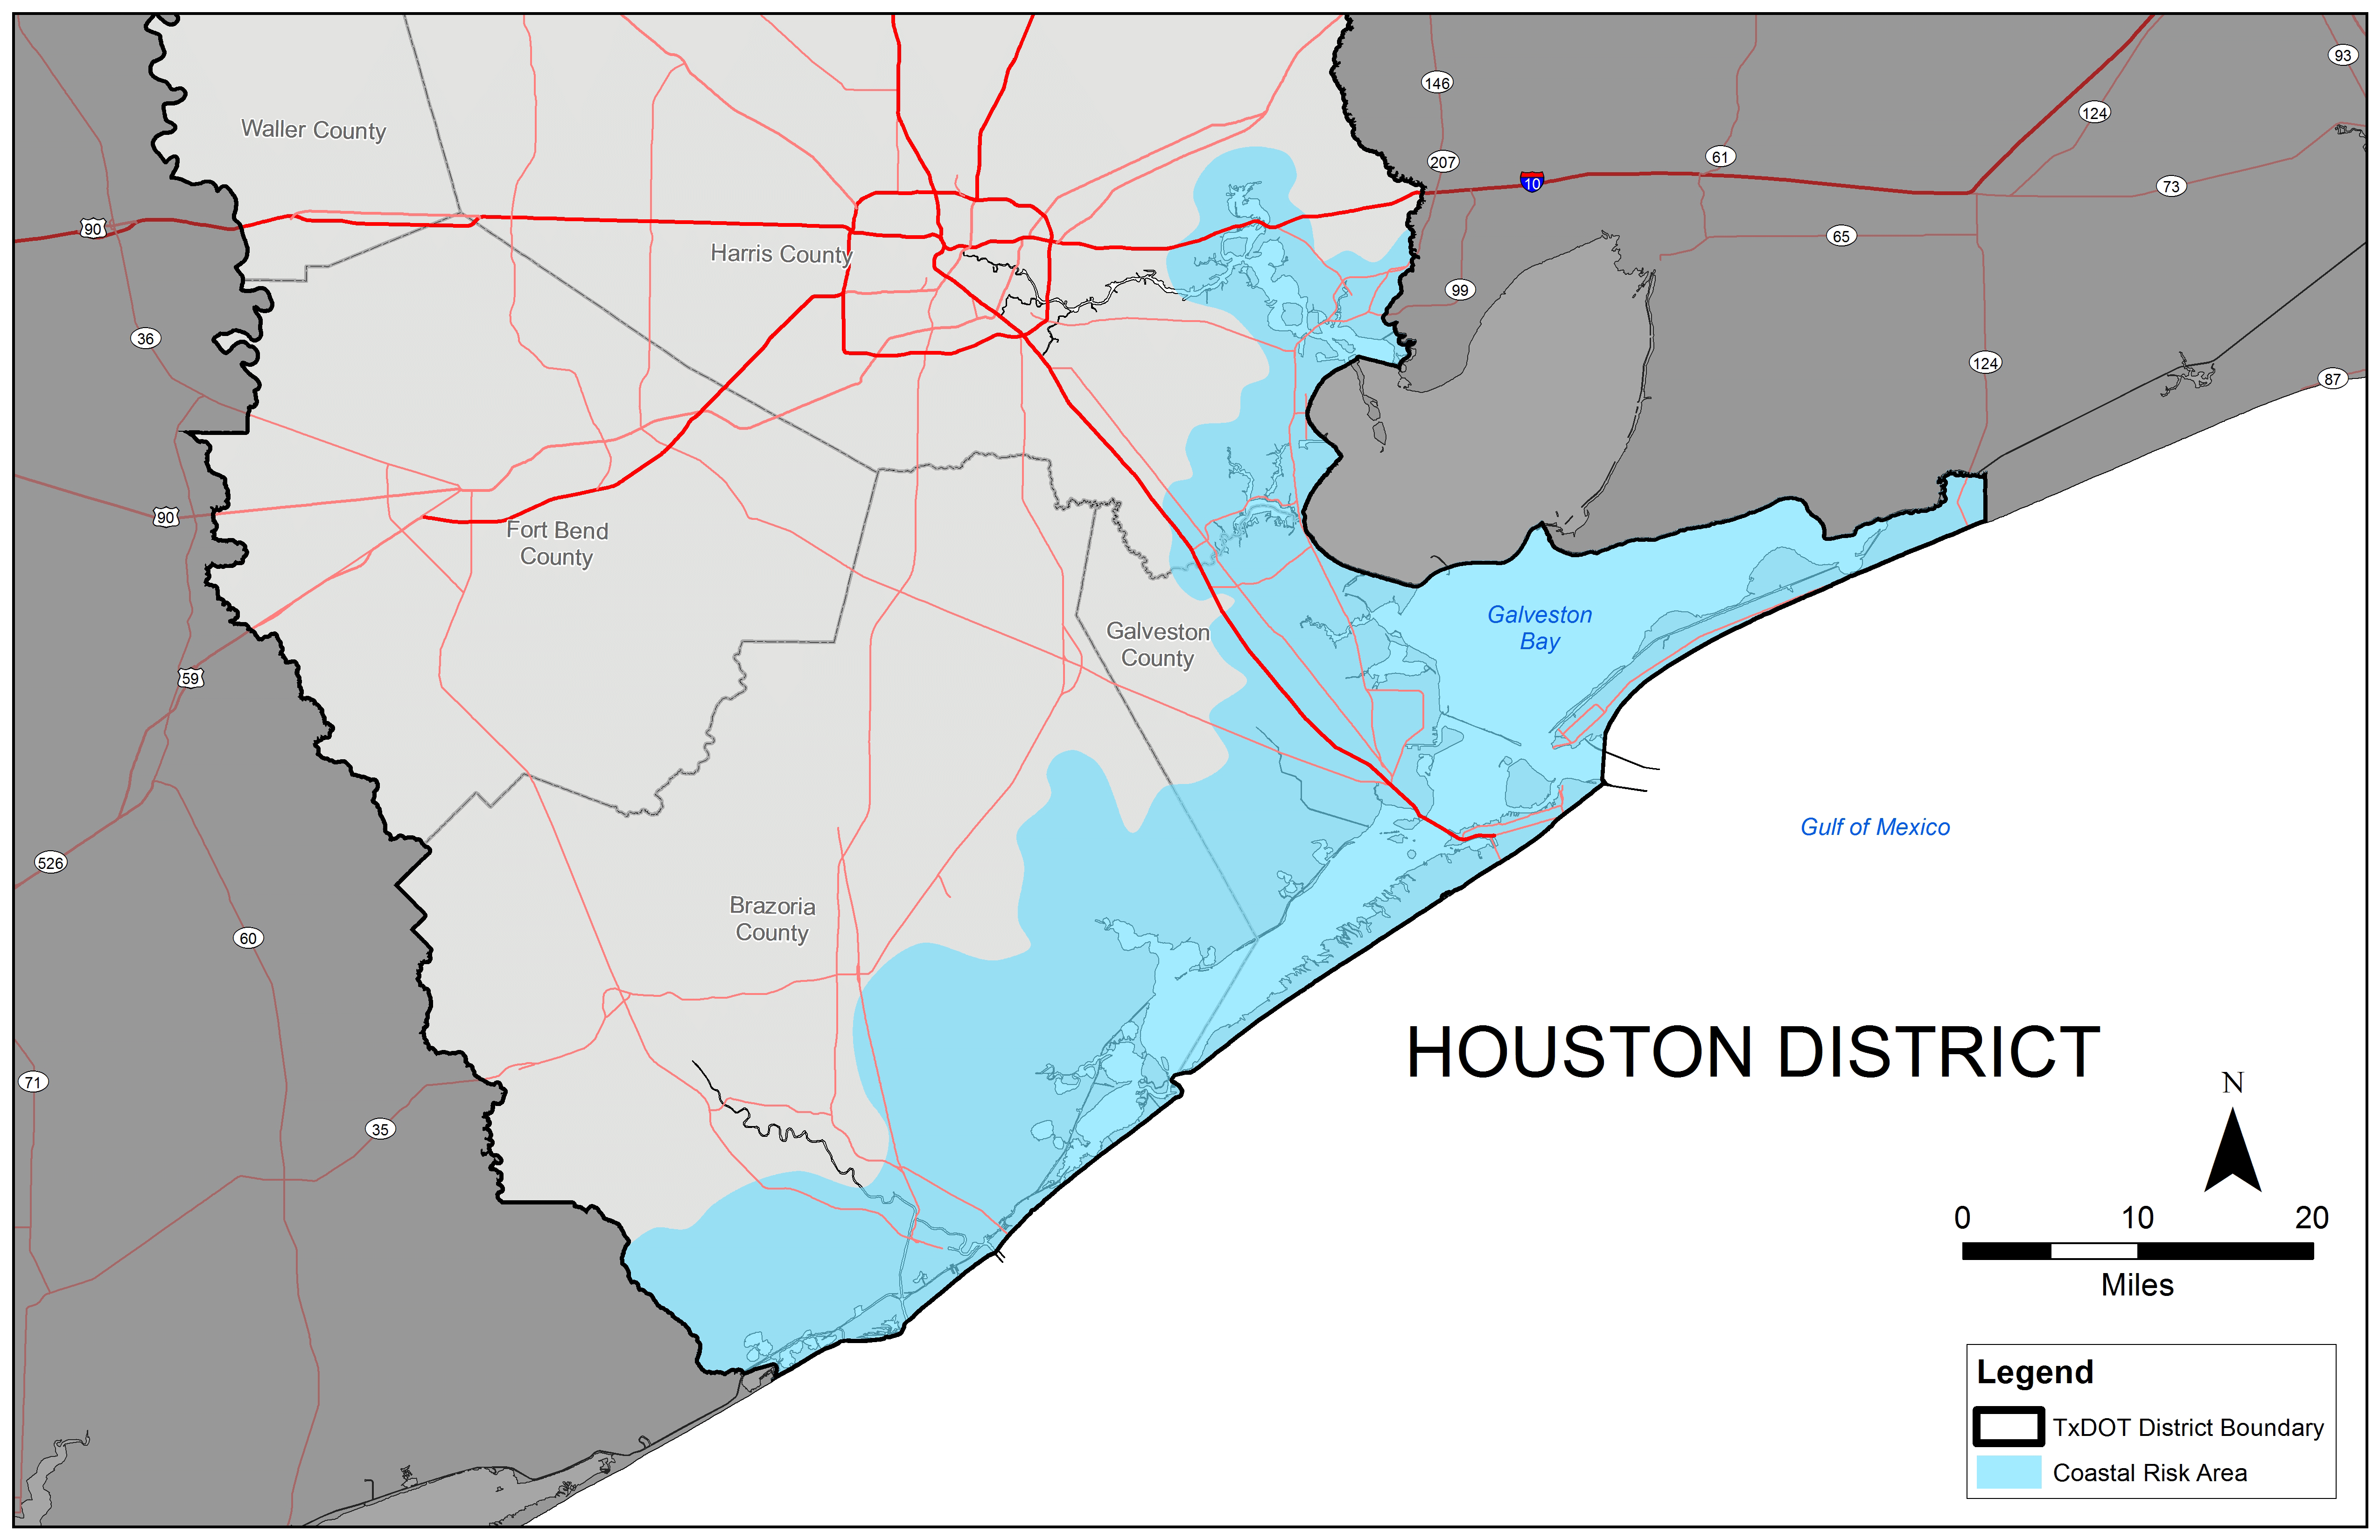
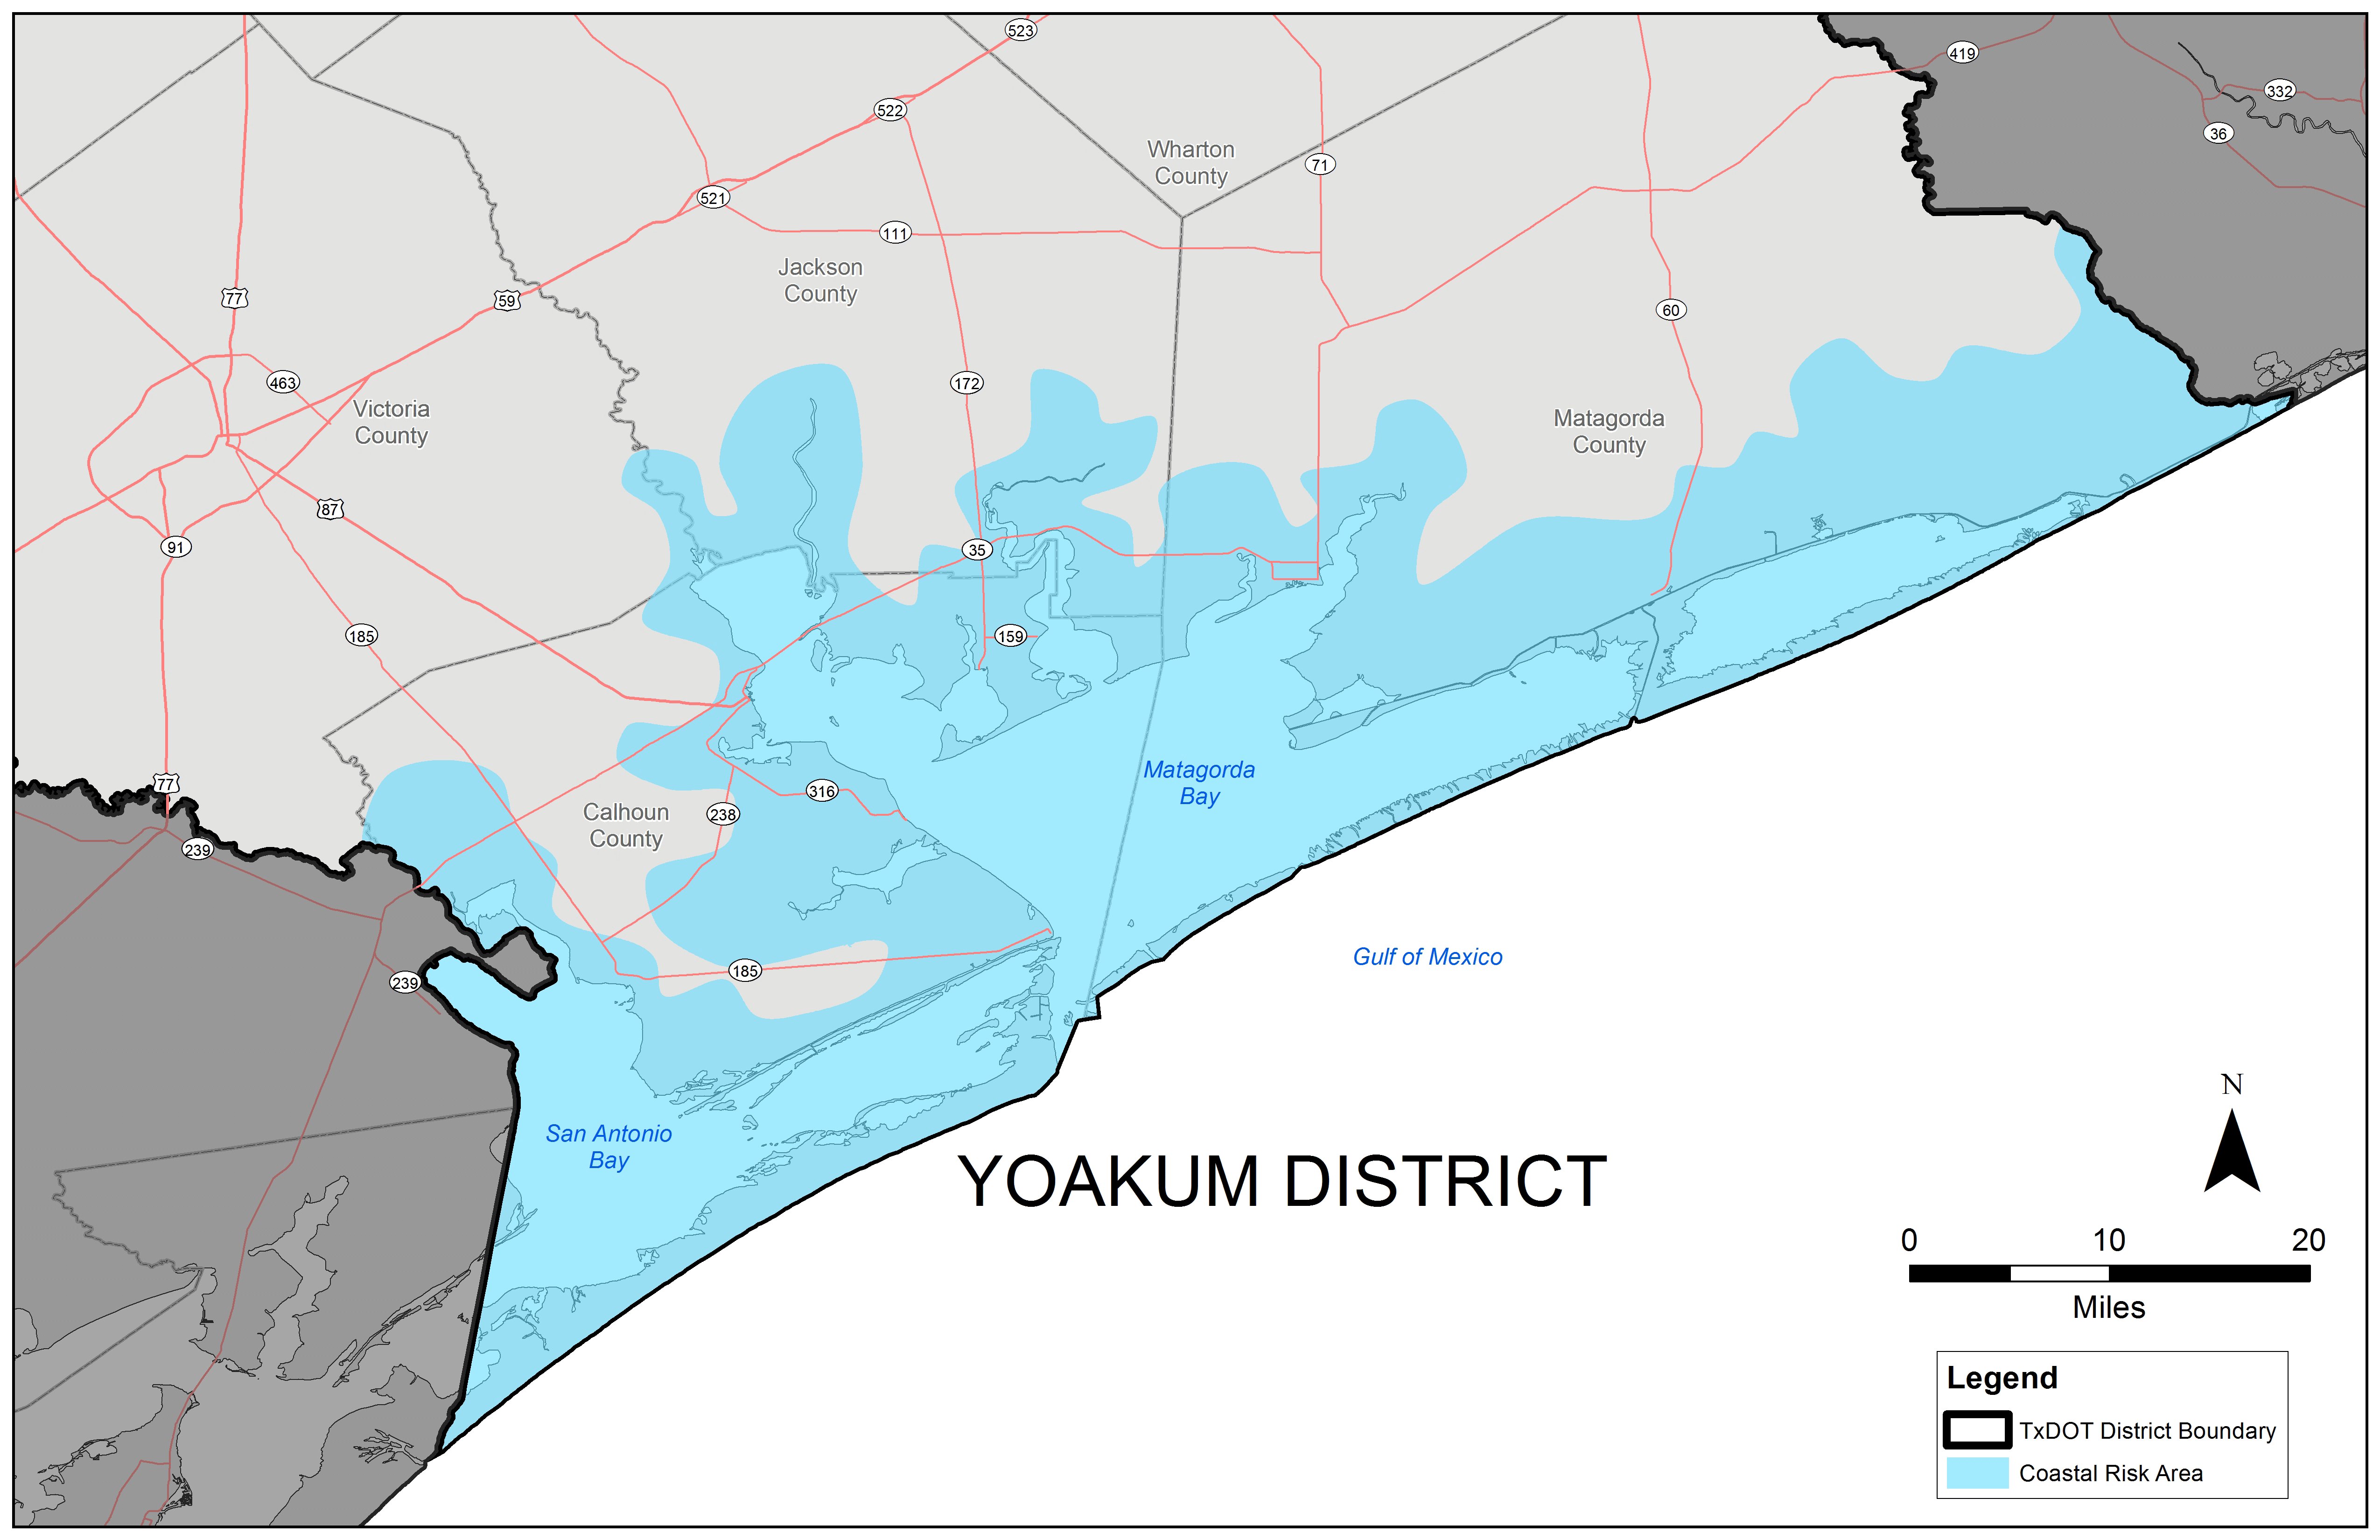
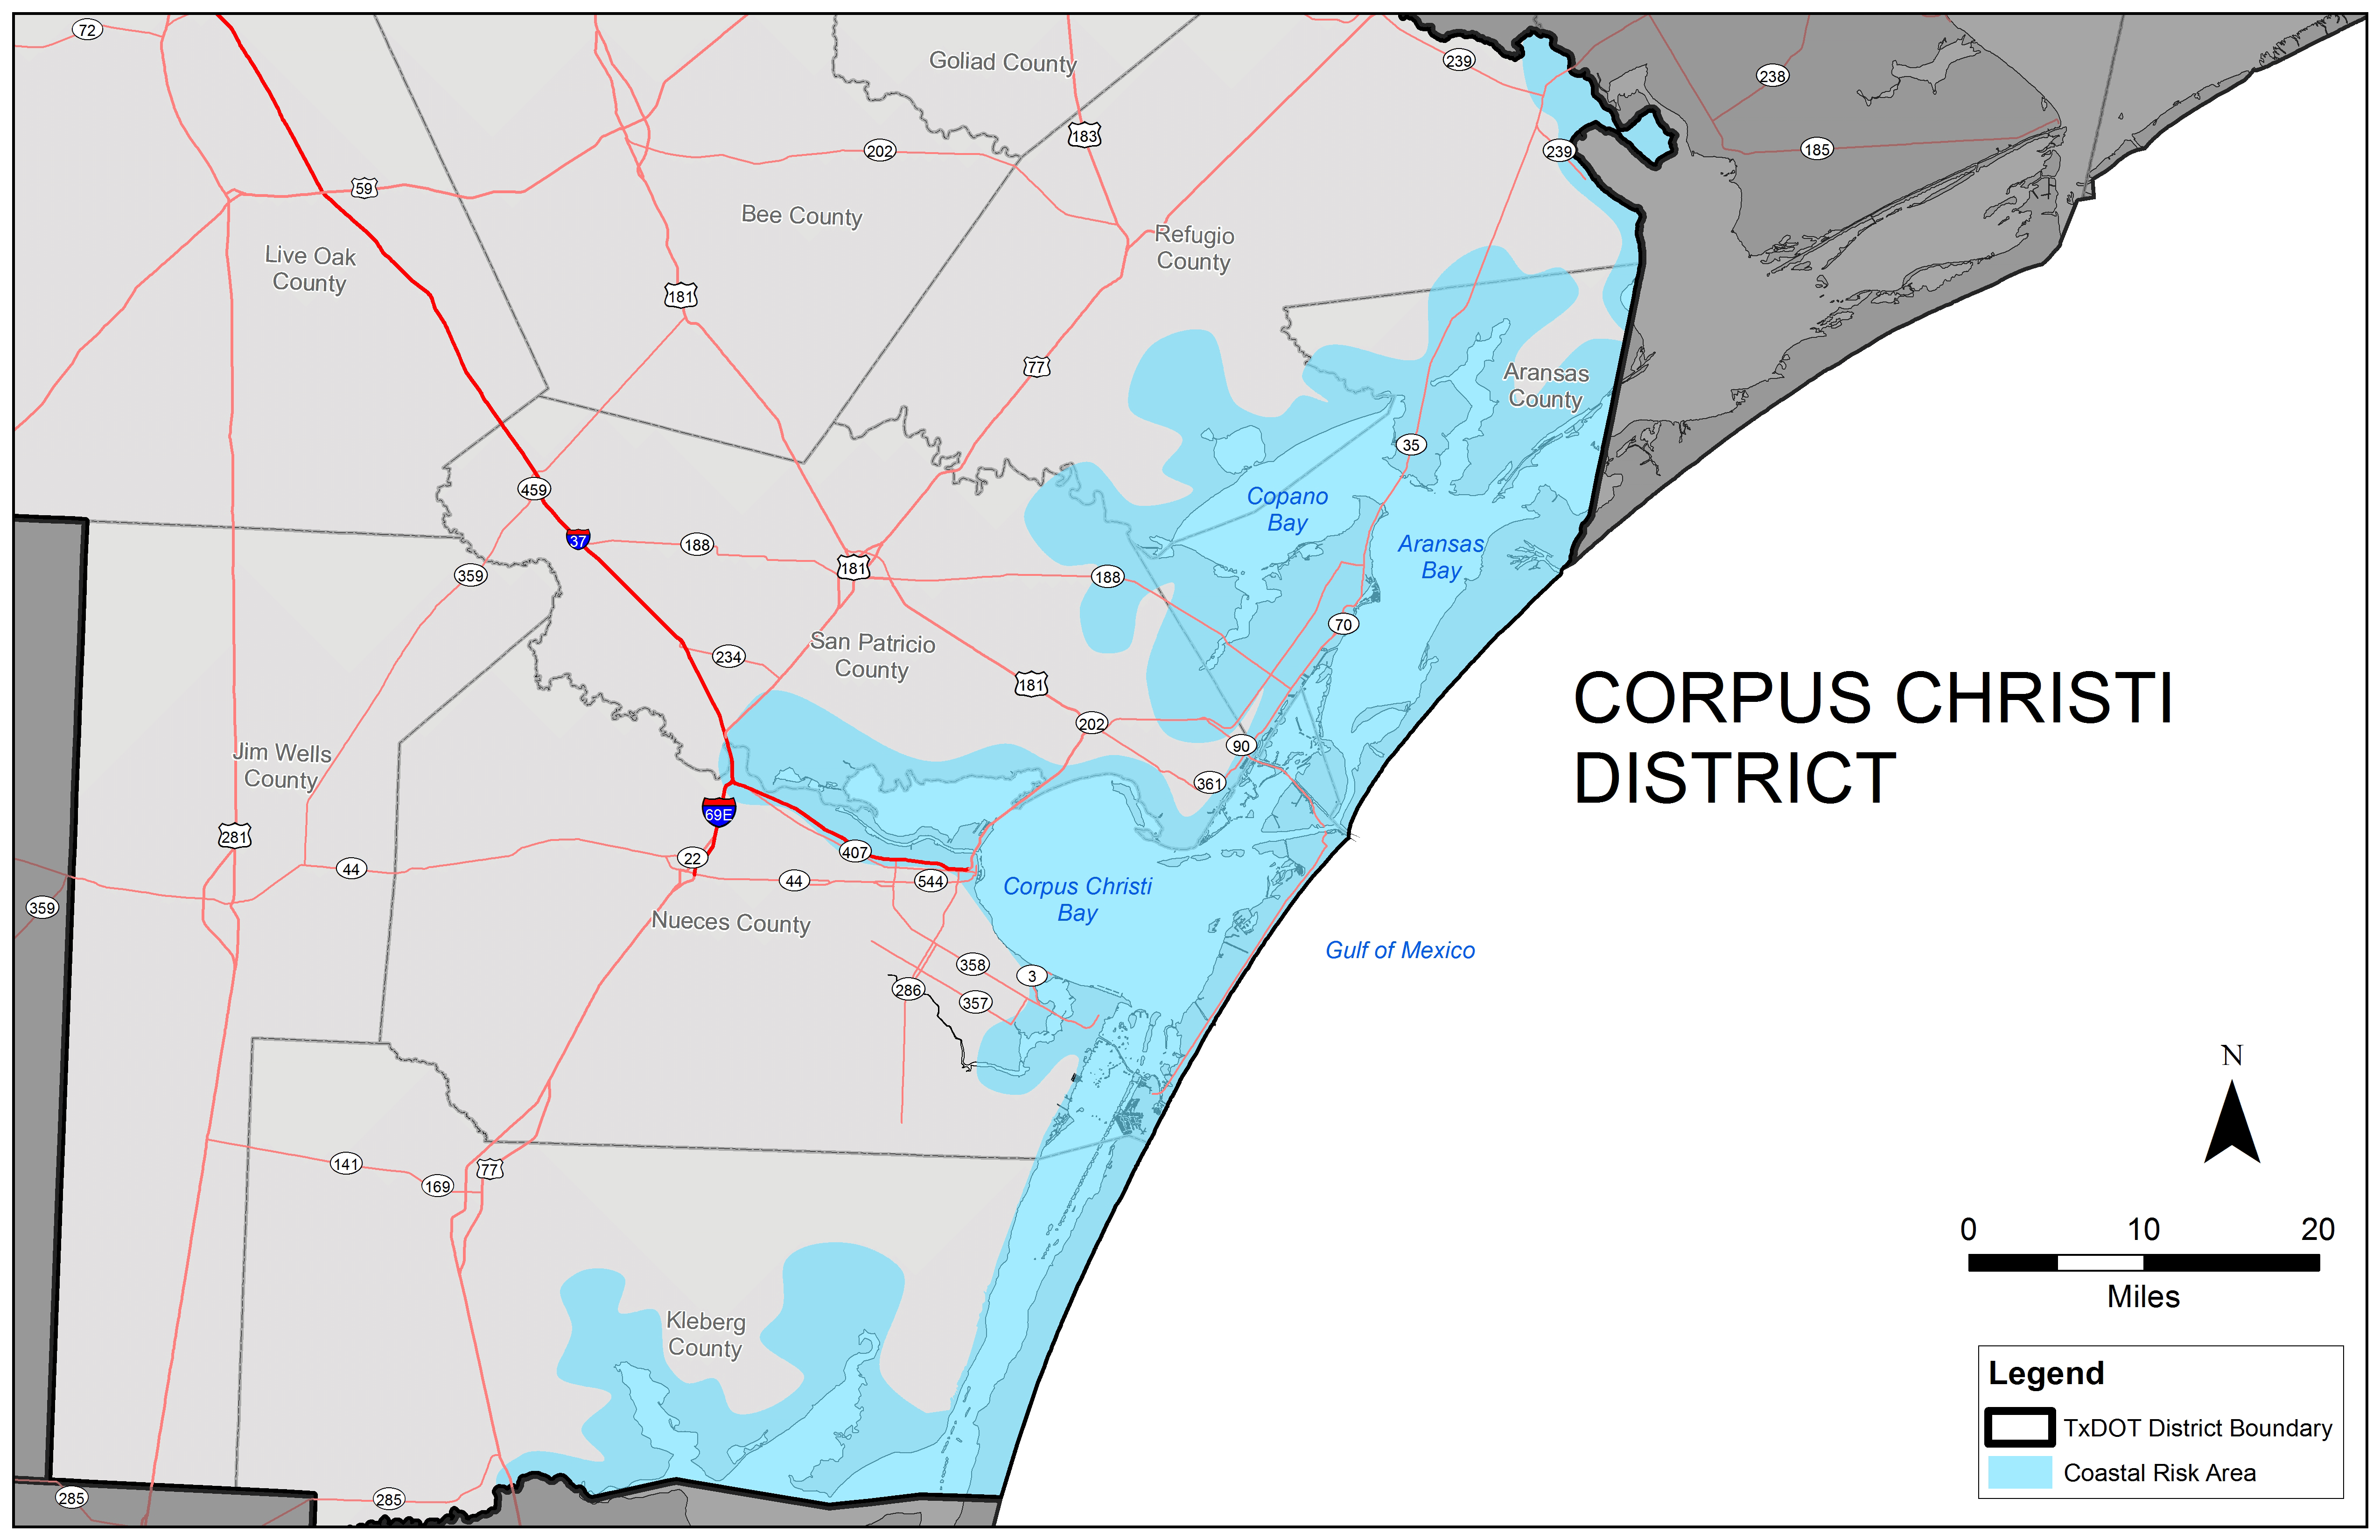
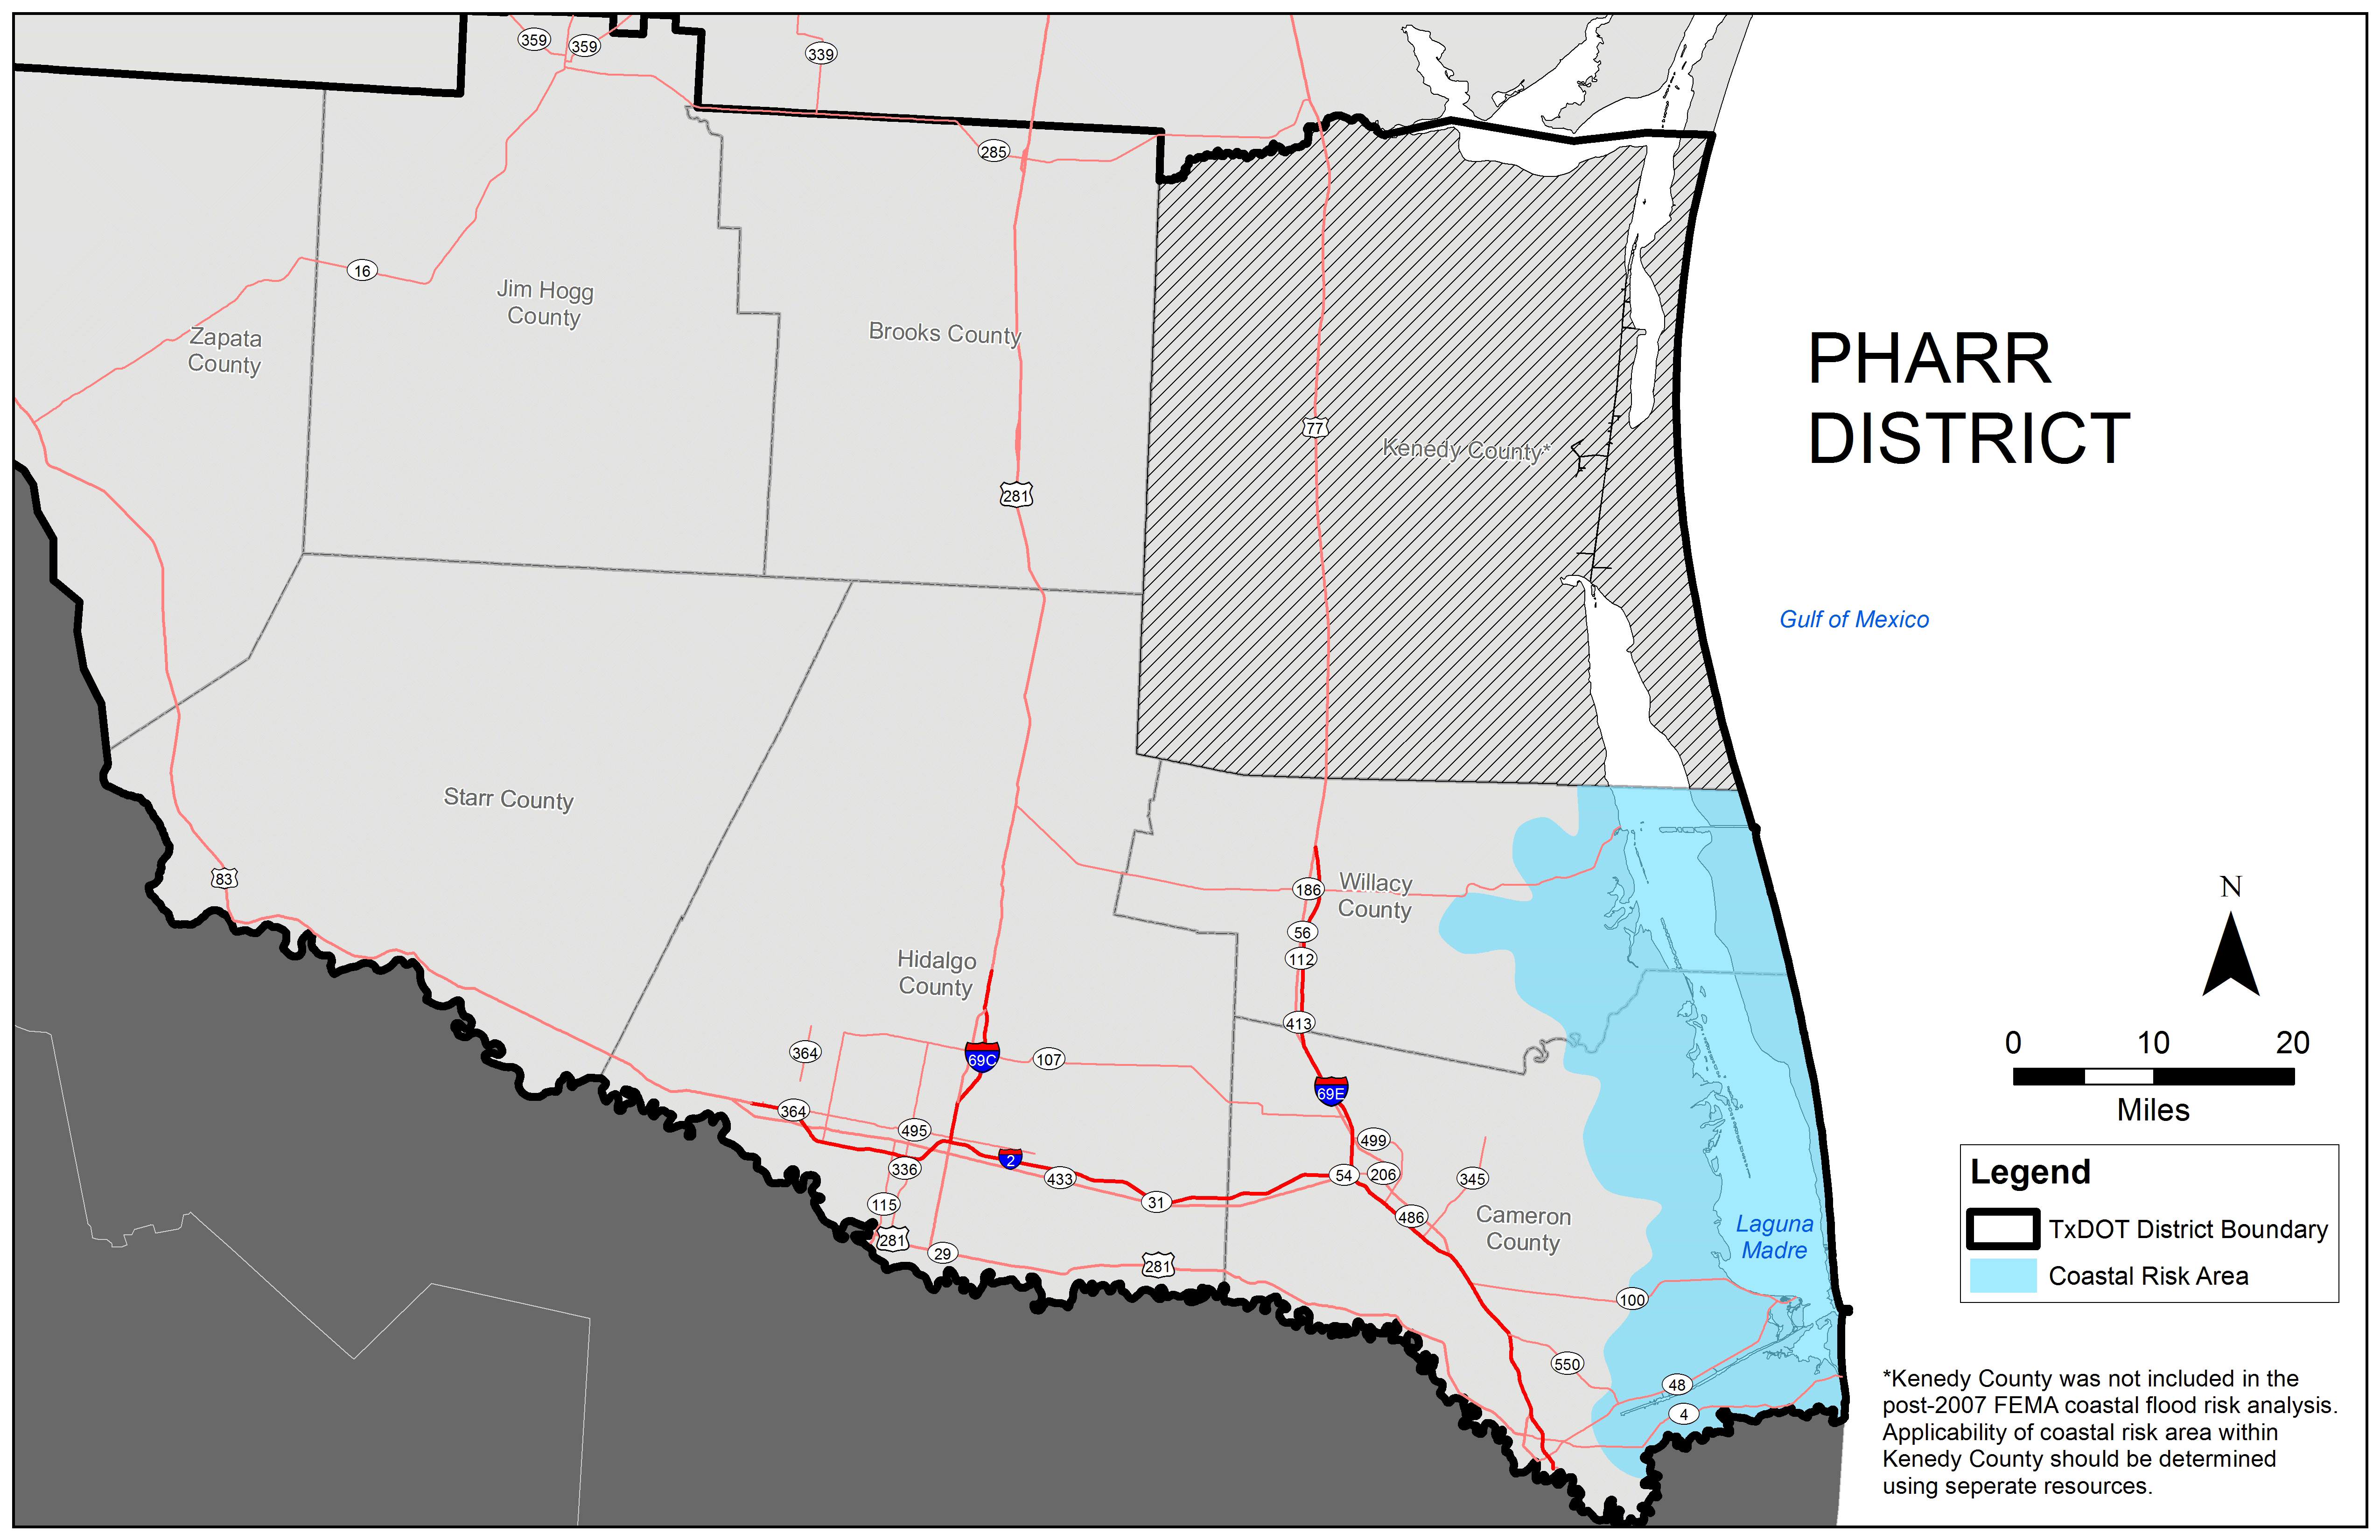
To determine whether the project needs to consider coastal engineering concepts, this section includes maps representing the five districts within TxDOT that are along the coast (Figure 15-1 through Figure 15-5). Each map shows an area defined as the Coastal Risk Area; the designer should consider the coastal forces and guidance presented in this chapter if a project is within this area. The extents of the Coastal Risk Area were derived using Federal Emergency Management Agency (FEMA) designated coastal VE and AE zones. The shown Coastal Risk Area serves only as initial guidance on applicability, and it is incumbent upon the project team to further assess and define the potential for coastal forces to impact any given project.
Additionally, some projects not included in the Coastal Risk Area still may need to consider this design guidance. Consider using this document if the project is:
- Anchor: #XSPOKYXE
- Located along inland lake shorelines where wave action and inland fetch can create wave forces that require consideration during design (further discussed below), or Anchor: #VARBKAQX
- Located in a coastal county (Aransas, Brazoria, Calhoun, Cameron, Chambers, Galveston, Harris, Jackson, Jefferson, Kenedy, Kleberg, Matagorda, Nueces, Orange, Refugio, San Patricio, Victoria, and Willacy), or Anchor: #KUVFNPIE
- Known to have historic evidence of coastal influence (e.g. coastal flooding), including impacts from extreme weather events, such as hurricanes.
The Coastal Risk Area shown in the district maps below will change in extent and risk classification over time, as the coast experiences erosion, subsidence, and sea level changes. The maps include a one to two mile buffer inland of the FEMA designated coastal zones to partially represent these additional considerations. All these processes may expand the area of influence from coastal processes further inland than shown.
Figure 15-1. TxDOT Beaumont District Coastal Risk Area.
Figure 15-2. TxDOT Houston District Coastal Risk Area.
Figure 15-3. TxDOT Yoakum District Coastal Risk Area.
Figure 15-4. TxDOT Corpus Christi District Risk Area.
Figure 15-5. TxDOT Pharr District Risk Area.
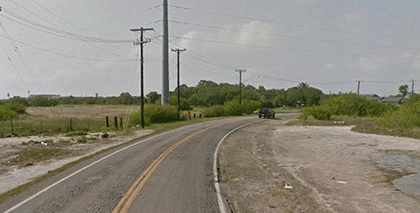
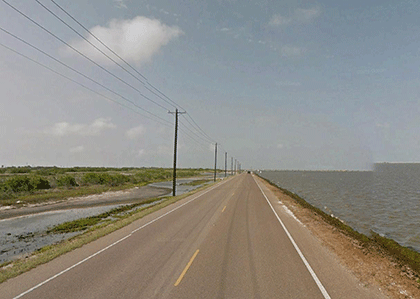
Design for some projects located near inland water bodies should also consider coastal guidance, especially if surrounding areas may experience or have experienced erosion or other damage caused by wave conditions.
Anchor: #i1025196How to Use This Document
This document is intended to be a guide when designing or evaluating transportation facilities in coastal areas. Input from a TxDOT Precertified Coastal Engineer during the project’s design phase will also help by providing a better understanding of the coastal processes influencing the study site.
Step 1: Determine whether the project is located within an area influenced by coastal processes.
Step 2: Determine the level of coastal analysis that the project requires, with this guidance following designations of Level 1, Level 2 or Level 3. As part of the level designation, the designer should use this document to evaluate what factors may impact the design. There are several factors that may influence design of coastal projects including: waves, wind, water depths and velocities, water surface elevations, tropical storms and hurricanes, and project location relative to the coast. Each of these factors is discussed within this chapter.
The procedure to determine the level of analysis is presented in the following section. It should be noted that the level of analysis can vary for a given project for different factors. For example, a project could have minimal risk of scour when evaluating a coastal roadway inland of the shoreline, justifying a Level 1 analysis for scour, but the presence of shoreline erosion and need for a higher roadway elevation may be of more concern, justifying a Level 2 analysis of those factors.
Anchor: #i1025221Level 1, 2, and 3 Analysis Discussion and Examples
To assist the reader, three categories of projects have been created, labeled as Level 1, Level 2, and Level 3. These represent an increase in complexity, vulnerability, and effort from Level 1 to Level 3. The purpose of these categories is to assist the designer when determining how to apply the elements described within this chapter.
The most common level of analysis for TxDOT projects influenced by coastal processes is Level 1. Level 1 analyses are typically represented as having either a project that includes lower levels of investment by TxDOT or the factor has limited vulnerability to coastal forces. An example of this is a project located landward of the FEMA Limit of Moderate Wave Action line when considering wave analysis as the specific factor of interest. Coastal analysis for a Level 1 project will typically be based on solely evaluating existing coastal data.
Level 2 analyses are less frequent than Level 1, but more common the Level 3. These analyses may represent projects with moderate to high levels of investment by TxDOT and include factors that represent exposure to moderate coastal vulnerabilities. Coastal analysis for a Level 2 project will typically involve leveraging existing data for the more complex factors, such as stillwater level or scour, and in addition commonly require coastal models to develop additional necessary data for design, particularly with regard to wave analysis.
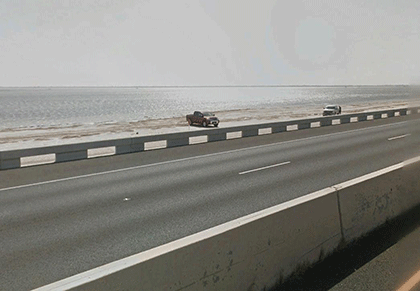
Level 3 analyses are rare within TxDOT. These are typified by high risk projects such as causeways or other significant coastal roadways with high levels of investment, often serving as major evacuation routes, with high vulnerability. Level 3 analyses require extensive data acquisition and modeling effort to develop project specific data for complex designs.
These three representative categories are introduced in Table 15-1 and will be referenced throughout this chapter. These levels are intentionally not prescriptively delineated as it is the responsibility of the District and engineer of record to review and determine the appropriate level of analysis for each project. This decision is similar to riverine modeling decisions when deciding the complexity of modeling that should be performed – approximate, detailed, or complex. Under this concept, one project may have multiple levels of analysis, such as a causeway project (Level 3) that also has several miles of approach road (Level 2). This decision will typically be made during scoping and documented in the DSR.
|
|
Level 1 Analysis |
Level 2 Analysis |
Level 3 Analysis |
|---|---|---|---|
|
Approximate Frequency |
Most common |
Less common |
Infrequent |
|
Road Type |
Off-system and minor arterials in less critical areas |
Various roadway types up to and including interstates in less/moderately critical areas– |
Highly vulnerable routes, freeways/interstates in very critical areas |
|
Bridge Type |
Less critical bridges over a tidal creek in shallow estuary with minimal coastal scour risk |
Less/moderately critical bridge that is well-protected with minimal coastal impacts; moderate coastal scour risk |
Highly critical or major evacuation route bridges; severe or dynamic coastal scour risk |
|
Vulnerability |
Low to Moderate |
Moderate to High |
High |
|
Road Type Example |
Local or minor arterial, less critical roadway |
Principal arterial, but less critical road with armoring needs, located in FEMA Coastal AE/VE Zone |
Interstate with seawall located along major evacuation route |
|
Bridge Type Example |
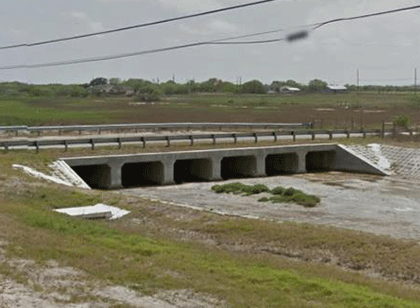
Culvert or small bridge in AE Zone, well-protected, local road |
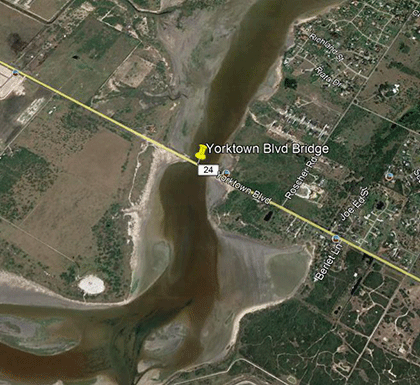
Small bridge over protected bay in AE zone, local road |
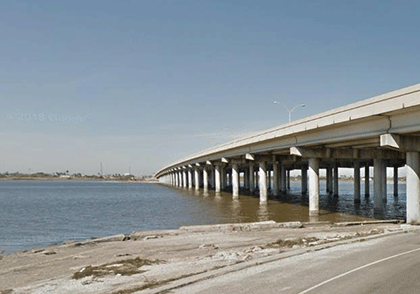
Causeway connecting mainland and barrier island |
|
Other Considerations |
Less complex analysis may require more conservative design assumptions, which can increase overall construction cost. |
More complex analysis may be more time intensive and costly during the design phase, but can reduce overall construction cost for level of protection needed. |
Complex geometries can cause waves to change direction or height; accounting for these complexities may not be feasible with simple analytical methods. |
Anchor: #i1025253
Chapter Overview
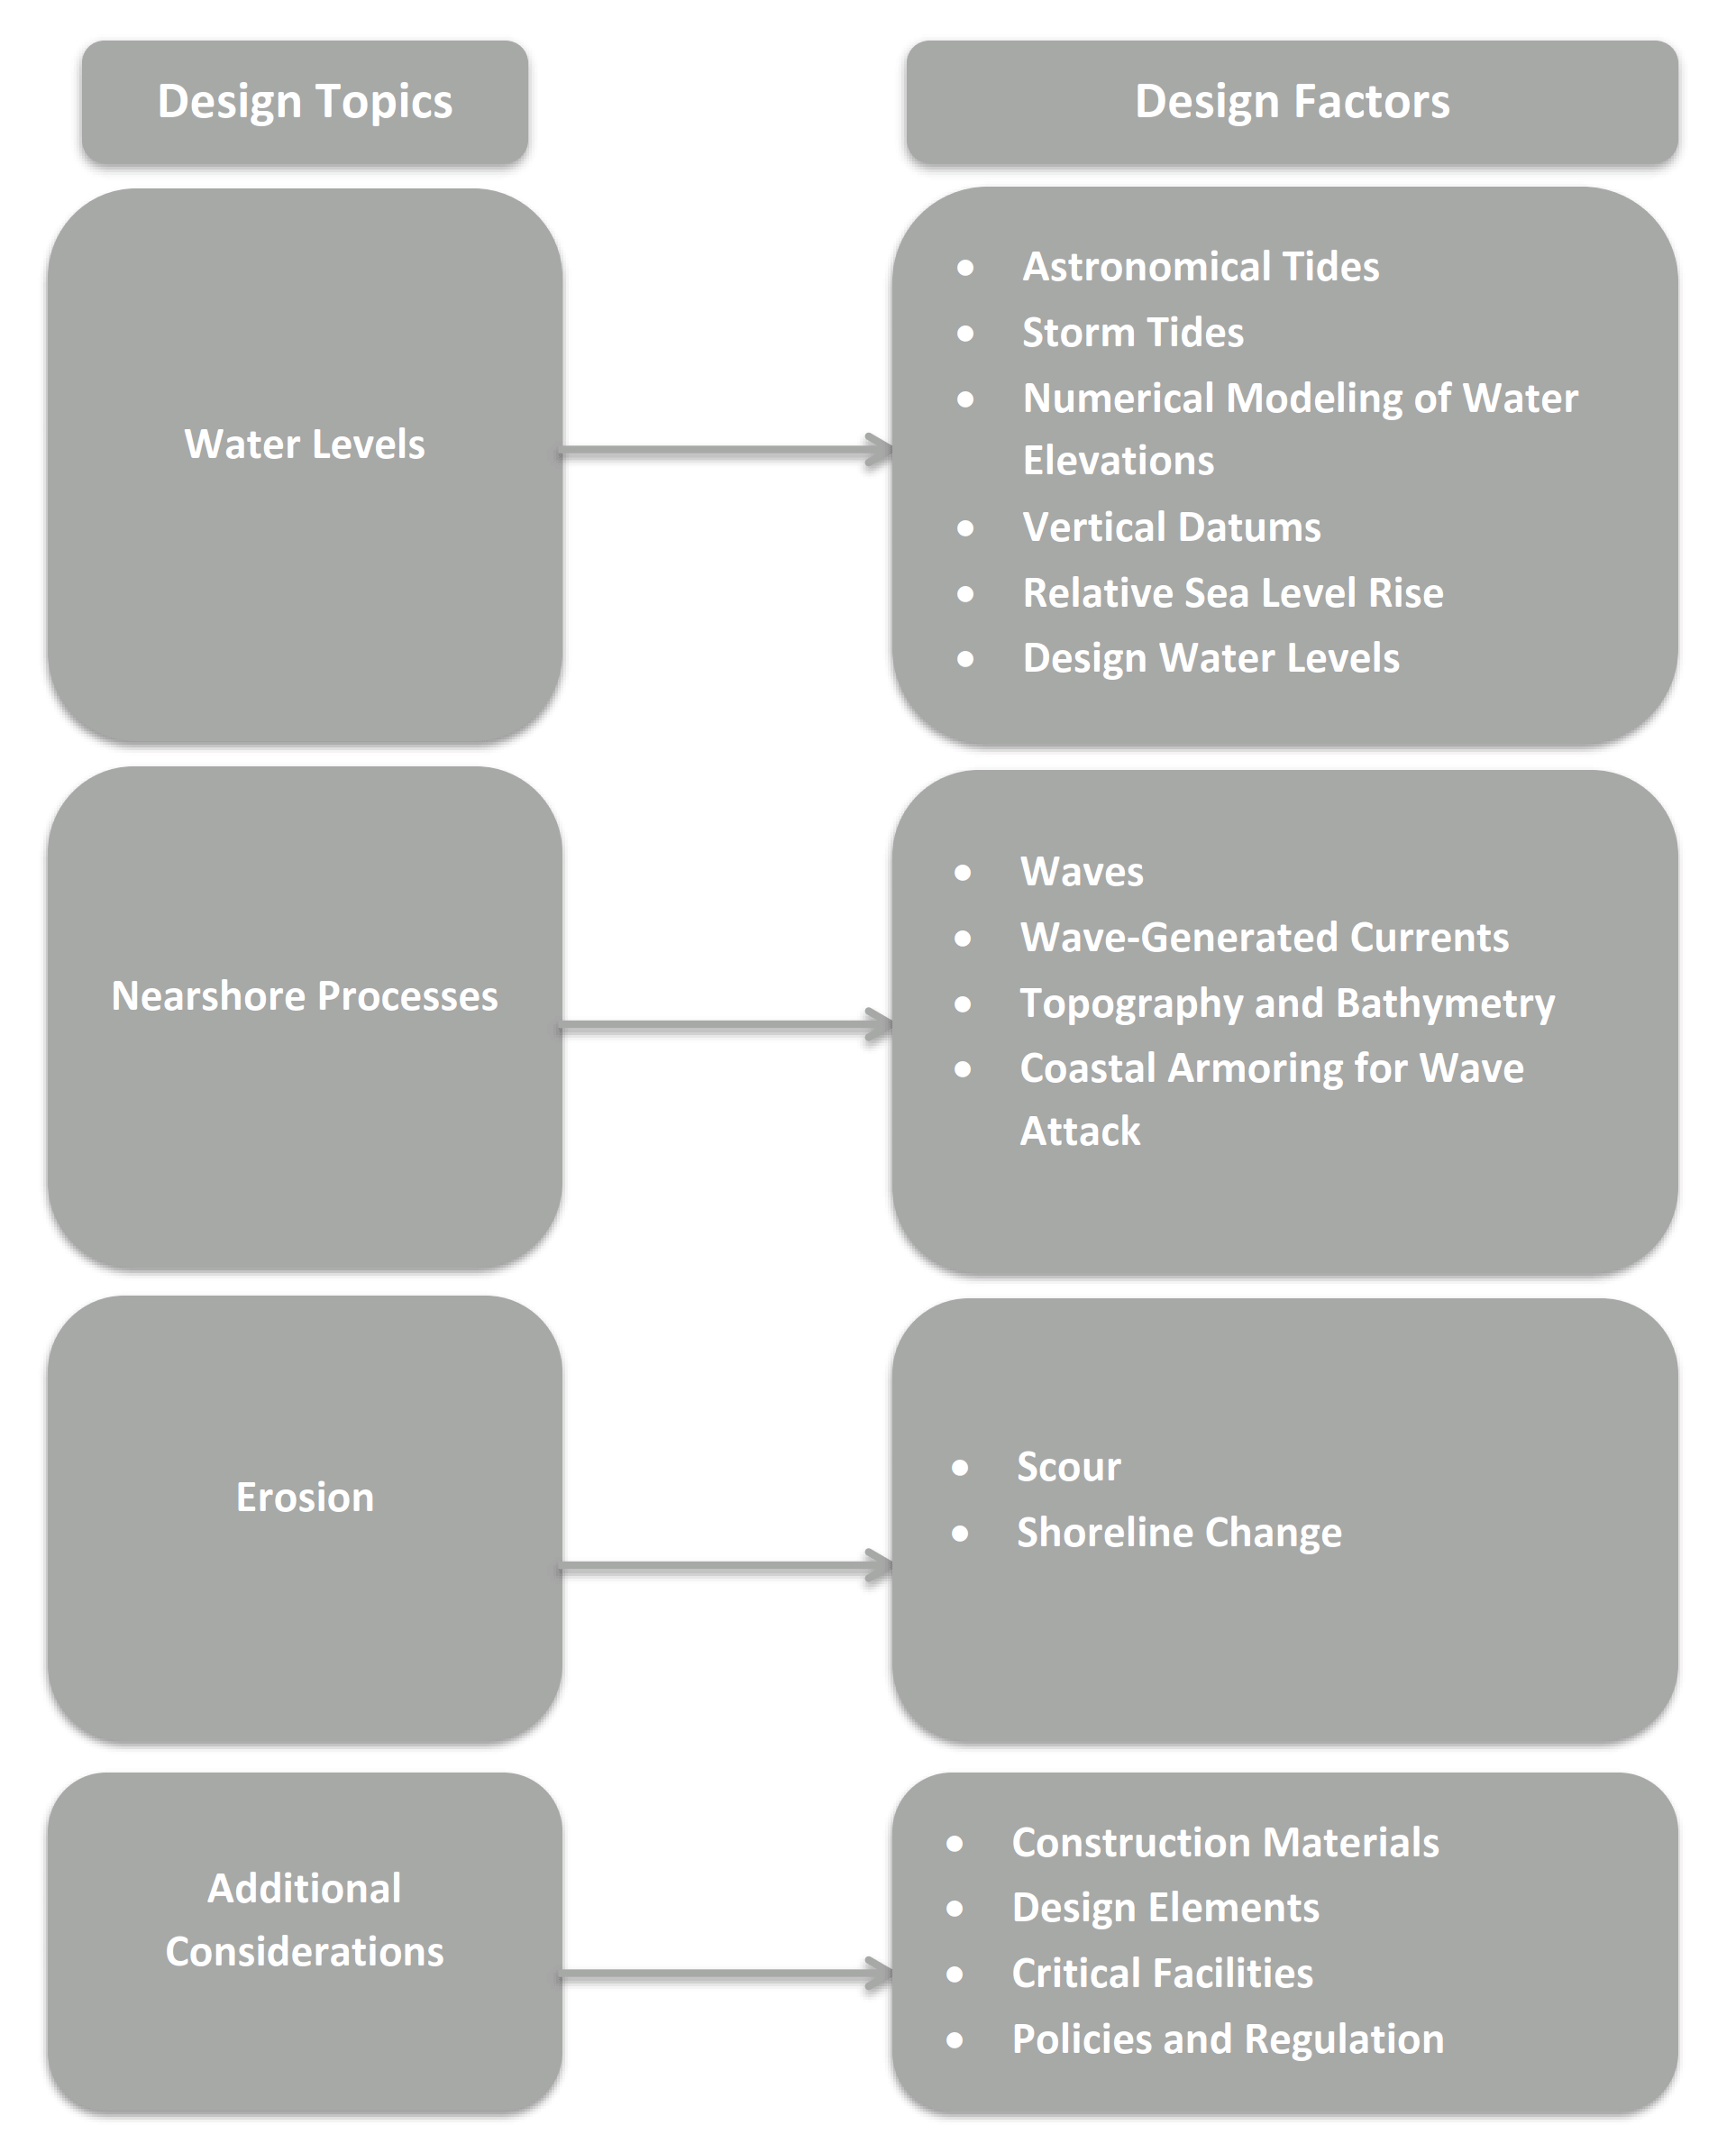
An overview of the elements to be reviewed in this chapter is shown in Figure 15-6, below.
Figure 15-6. Design Topics and Design Factors.
