Section 11: Time of Concentration
Time of concentration (tc) is the time required for an entire watershed to contribute to runoff at the point of interest for hydraulic design; this time is calculated as the time for runoff to flow from the most hydraulically remote point of the drainage area to the point under investigation. Travel time and tc are functions of length and velocity for a particular watercourse. A long but steep flow path with a high velocity may actually have a shorter travel time than a short but relatively flat flow path. There may be multiple paths to consider in determining the longest travel time. The designer must identify the flow path along which the longest travel time is likely to occur.
In watersheds with low (flat) topographic slope, the calculation of tc using commonly accepted equations with slope in the denominator often results in unreasonably large values. That is, as the slope approaches zero, the travel time approaches infinity. In addition, since intensity is a function of depth divided by tc, a long tc produces a very small intensity and thus small flowrate. Cleveland et al. 2012 recommends an adjustment of 0.0005 to the slope in both the Kerby and Kirpich methods to allow more realistic results for low topographic slope watersheds.
- Anchor: #NLIOWTQT
- The adjusted slope becomes Slow slope = S0 + 0.0005 (dimensionless) Anchor: #FLIXAVIM
- If the slope is less than 0.002 ft/ft (0.2%), a low slope condition exists and the adjusted slope should be used. Anchor: #FPHKRPKB
- If the slope is between 0.002 ft/ft (0.2%) and 0.003 ft/ft (0.3%), the situation is transitional and the user must use judgment on whether or not to use the low slope adjustment.
When runoff is computed using the rational method, tc is the appropriate storm duration and in turn determines the appropriate precipitation intensity.
When peak discharge and streamflow timing are computed using the hydrograph method, tc is used to compute certain rainfall-runoff parameters for the watershed. The value of tc is used as an input to define the appropriate storm duration and appropriate precipitation depth.
When applicable, the Kerby-Kirpich method (Roussel et al. 2005) can be used for estimating tc. The National Resources Conservation Service (1986) method is also commonly used and acceptable. Both of these methods estimate tc as the sum of travel times for discrete flow regimes. One good practice is to run both methods concurrently and compare results. Another good practice is to compare tc values against either watershed length or area for multiple basins across each project to assess reasonableness of results.
Anchor: #i1108009Kerby-Kirpich Method
Roussel et al. 2005 conclude that, in general, Kirpich-inclusive approaches, [and particularly] the Kerby-Kirpich approach, for estimating watershed time of concentration are preferable. The Kerby-Kirpich approach requires comparatively few input parameters, is straightforward to apply, and produces readily interpretable results. The Kerby-Kirpich approach produces time of concentration estimates consistent with watershed time values independently derived from real-world storms and runoff hydrographs. Similar to other methods for calculation of tc, the total time of concentration is obtained by adding the overland flow time (Kerby) and the channel flow time (Kirpich):
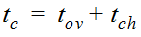
Equation 4-13.
Where:
tov = overland flow time
tch = channel flow time
The Kerby-Kirpich method for estimating tc is applicable to watersheds ranging from 0.25 square miles to 150 square miles, main channel lengths between 1 and 50 miles, and main channel slopes between 0.002 and 0.02 (ft/ft) (Roussel et al. 2005).
Main channel slope is computed as the change in elevation from the watershed divide to the watershed outlet divided by the curvilinear distance of the main channel (primary flow path) between the watershed divide and the outlet.
No watersheds with low topographic slopes are available in the underlying database. Therefore, the Kerby and Kerpich methods are not usually applicable to watersheds with limited topographic slope. However, Cleveland et al. 2012 makes recommendations for adjustments to the method to allow more realistic results for low topographic slope watersheds. See Time of Concentration.
Anchor: #i1108172The Kerby Method
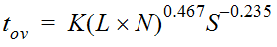
For small watersheds where overland flow is an important component of overall travel time, the Kerby method can be used. The Kerby equation is
Equation 4-14.
Where:
- Anchor: #NHGKKIEI
- tov = overland flow time of concentration, in minutes Anchor: #LMHFFMIG
- K = a units conversion coefficient, in which K = 0.828 for traditional units and K = 1.44 for SI units Anchor: #JOJNJEHG
- L = the overland-flow length, in feet or meters as dictated by K Anchor: #NTHKEMKH
- N = a dimensionless retardance coefficient Anchor: #LLGGHMEL
- S = the dimensionless slope of terrain conveying the overland flow
In the development of the Kerby equation, the length of overland flow was as much as 1,200 feet (366 meters). Hence, this length is considered an upper limit and shorter values in practice generally are expected. The dimensionless retardance coefficient used is similar in concept to the well-known Manning's roughness coefficient; however, for a given type of surface, the retardance coefficient for overland flow will be considerably larger than for open-channel flow. Typical values for the retardance coefficient are listed in Table 4-5. Roussel et al. 2005 recommends that the user should not interpolate the retardance coefficients in Table 4-5. If it is determined that a low slope condition or a transitional slope condition exists, the user should consider using an adjusted slope in calculating the time of concentration. See Time of Concentration.
|
Generalized terrain description |
Dimensionless retardance coefficient (N) |
|---|---|
|
Pavement |
0.02 |
|
Smooth, bare, packed soil |
0.10 |
|
Poor grass, cultivated row crops, or moderately rough packed surfaces |
0.20 |
|
Pasture, average grass |
0.40 |
|
Deciduous forest |
0.60 |
|
Dense grass, coniferous forest, or deciduous forest with deep litter |
0.80 |
Anchor: #i1108228
The Kirpich Method
For channel-flow component of runoff, the Kirpich equation is:
Equation 4-15.
Where:
- Anchor: #HKIJIMGI
- tch = the time of concentration, in minutes Anchor: #JPGLIHKL
- K = a units conversion coefficient, in which K = 0.0078 for traditional units and K = 0.0195 for SI units Anchor: #GOFMHFKF
- L = the channel flow length, in feet or meters as dictated by K Anchor: #HLKEEJGG
- S = the dimensionless main-channel slope
If it is determined that a low slope condition or a transitional slope condition exists, the user should consider using an adjusted slope in calculating the time of concentration. See Time of Concentration.
Application of the Kerby-Kirpich Method
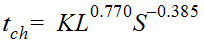
An example (shown below) illustrating application of the Kerby-Kirpich method is informative. For example, suppose a hydraulic design is needed to convey runoff from a small watershed with a drainage area of 0.5 square miles. On the basis of field examination and topographic maps, the length of the main channel from the watershed outlet (the design point) to the watershed divide is 5,280 feet. Elevation of the watershed at the outlet is 700 feet. From a topographic map, elevation along the main channel at the watershed divide is estimated to be 750 feet. The analyst assumes that overland flow will have an appreciable contribution to the time of concentration for the watershed. The analyst estimates that the length of overland flow is about 500 feet and that the slope for the overland-flow component is 2 percent (S = 0.02). The area representing overland flow is average grass (N = 0.40). For the overland-flow tc, the analyst applies the Kerby equation,
from which tov is about 25 minutes. For the channel tch, the analyst applies the Kirpich equation, but first dimensionless main-channel slope is required,
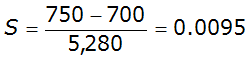
or about 1 percent. The value for slope and the channel length are used in the Kirpich equation,

from which tch is about 32 minutes. Because the overland flow tov is used for this watershed, the subtraction of the overland flow length from the overall main-channel length (watershed divide to outlet) is necessary and reflected in the calculation. Adding the overland flow and channel flow components gives total time of concentration for a watershed of about 57 minutes. Finally, as a quick check, the analyst can evaluate the tc by using an ad hoc method representing tc, in hours, as the square root of drainage area, in square miles. For the example, the square root of the drainage area yields a tc estimate of about 0.71 hours or about 42 minutes, which is reasonably close to 57 minutes. However, 57 minutes is preferable. This example is shown in Figure 4-7.
")
Figure 4-7. Example application of Kerby-Kirpich method
Anchor: #i1108490Natural Resources Conservation Service (NRCS) Method for Estimating tc
The NRCS method for estimating tc is applicable for small watersheds, in which the majority of flow is overland flow such that timing of the peak flow is not significantly affected by the contribution flow routed through underground storm drain systems. With the NRCS method:
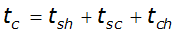
Equation 4-16.
Where:
- Anchor: #LJTHILJE
- tsh = sheet flow travel time Anchor: #MFJLIIKL
- tsc = shallow concentrated flow travel time Anchor: #ENPNJMHK
- tch = channel flow travel time
NRCS 1986 provides the following descriptions of these flow components:
Sheet flow is flow over plane surfaces, usually occurring in the headwater of streams. With sheet flow, the friction value is an effective roughness coefficient that includes the effect of raindrop impact; drag over the plane surface; obstacles such as litter, crop ridges, and rocks; and erosion and transportation of sediment.
Sheet flow usually becomes shallow concentrated flow after around 100 feet.
Open channels are assumed to begin where surveyed cross section information has been obtained, where channels are visible on aerial photographs, or where blue lines (indicating streams) appear on USGS quadrangle sheets.
For open channel flow, consider the uniform flow velocity based on bank-full flow conditions. That is, the main channel is flowing full without flow in the overbanks. This assumption avoids the significant iteration associated with rainfall intensity or discharges (because rainfall intensity and discharge are dependent on time of concentration).
For conduit flow, in a proposed storm drain system, compute the velocity at uniform depth based on the computed discharge at the upstream. Otherwise, if the conduit is in existence, determine full capacity flow in the conduit, and determine the velocity at capacity flow. You may need to compare this velocity later with the velocity calculated during conduit analysis. If there is a significant difference and the conduit is a relatively large component of the total travel path, recompute the time of concentration using the latter velocity estimate.
If it is determined that a low slope condition or a transitional slope condition exists, the user should consider using an adjusted slope in calculating the time of concentration. See Time of Concentration.
Anchor: #i1108551Sheet Flow Time Calculation
Sheet flow travel time is computed as:

Equation 4-17.
Where:
- Anchor: #JMPFFJGI
- tsh = sheet flow travel time (hr.) Anchor: #VEKELNLG
- nol = overland flow roughness coefficient (provided in Table 4-6) Anchor: #FJMHMHNG
- Lsh = sheet flow length (ft) (100 ft. maximum) Anchor: #LFOIEHIN
- P2 = 2-year, 24-h rainfall depth (in.) (provided in - NOAA's Precipitation Frequency Data Server for Atlas 14) Anchor: #GJKJGJNL
- Ssh = sheet flow slope (ft/ft)
|
Surface description |
nol |
|
|---|---|---|
|
Smooth surfaces (concrete, asphalt, gravel, or bare soil) |
0.011 |
|
|
Fallow (no residue) |
0.05 |
|
|
Cultivated soils: |
Residue |
0.06 |
|
|
Residue cover > 20% |
0.17 |
|
Grass: |
Short grass prairie |
0.15 |
|
|
Dense grasses |
0.24 |
|
|
Bermuda |
0.41 |
|
Range (natural): |
|
0.13 |
|
Woods: |
Light underbrush |
0.40 |
|
|
Dense underbrush |
0.80 |

NOTE: 'n' values for overland flows (nol) are not to be used in other channel or floodplain applications.
Anchor: #i1108603Shallow Concentrated Flow
Shallow concentrated flow travel time is computed as:
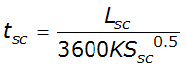
Equation 4-18.
Where:
- Anchor: #LKKJIJML
- tsc = shallow concentrated flow time (hr.) Anchor: #OJJGEIKI
- Lsc = shallow concentrated flow length (ft) Anchor: #KJILEKMH
- K = 16.13 for unpaved surface, 20.32 for paved surface Anchor: #JQLEJHJN
- Ssc = shallow concentrated flow slope (ft/ft)
Channel Flow
Channel flow travel time is computed by dividing the channel distance by the flow rate obtained from Manning’s equation. This can be written as:
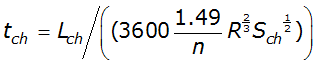
Equation 4-19.
Where:
- Anchor: #GFNLLFIE
- tch = channel flow time (hr.) Anchor: #EHGLJELL
- Lch = channel flow length (ft) Anchor: #NIKEEKFL
- Sch = channel flow slope (ft/ft) Anchor: #MGFKNMKH
- n = Manning’s roughness coefficient Anchor: #OENKHKFL
- R = channel hydraulic
radius (ft), and is equal to
 , where:
a = cross sectional area (ft2) and pw = wetted
perimeter (ft), consider the uniform flow velocity based on bank-full
flow conditions. That is, the main channel is flowing full without
flow in the overbanks. This assumption avoids the significant iteration
associated with other methods that employ rainfall intensity or
discharges (because rainfall intensity and discharge are dependent
on time of concentration).
, where:
a = cross sectional area (ft2) and pw = wetted
perimeter (ft), consider the uniform flow velocity based on bank-full
flow conditions. That is, the main channel is flowing full without
flow in the overbanks. This assumption avoids the significant iteration
associated with other methods that employ rainfall intensity or
discharges (because rainfall intensity and discharge are dependent
on time of concentration).
Manning’s Roughness Coefficient Values
Manning’s roughness coefficients are used to calculate flows using Manning’s equation. Values from American Society of Civil Engineers (ASCE) 1992, FHWA 2001, and Chow 1959 are reproduced in Table 4-7, Table 4-8, and Table 4-9.
|
Type of channel |
Manning’s n |
||
|---|---|---|---|
|
A. Natural streams |
|||
|
1. Minor streams (top width at flood stage < 100 ft) |
|||
|
a. Clean, straight, full, no rifts or deep pools |
0.025-0.033 |
||
|
b. Same as a, but more stones and weeds |
0.030-0.040 |
||
|
c. Clean, winding, some pools and shoals |
0.033-0.045 |
||
|
d. Same as c, but some weeds and stones |
0.035-0.050 |
||
|
e. Same as d, lower stages, more ineffective |
0.040-0.055 |
||
|
f. Same as d, more stones |
0.045-0.060 |
||
|
g. Sluggish reaches, weedy, deep pools |
0.050-0.080 |
||
|
h. Very weedy, heavy stand of timber and underbrush |
0.075-0.150 |
||
|
i. Mountain streams with gravel and cobbles, few boulders on bottom |
0.030-0.050 |
||
|
j. Mountain streams with cobbles and large boulders on bottom |
0.040-0.070 |
||
|
2. Floodplains |
|||
|
a. Pasture, no brush, short grass |
0.025-0.035 |
||
|
b. Pasture, no brush, high grass |
0.030-0.050 |
||
|
c. Cultivated areas, no crop |
0.020-0.040 |
||
|
d. Cultivated areas, mature row crops |
0.025-0.045 |
||
|
e. Cultivated areas, mature field crops |
0.030-0.050 |
||
|
f. Scattered brush, heavy weeds |
0.035-0.070 |
||
|
g. Light brush and trees in winter |
0.035-0.060 |
||
|
h. Light brush and trees in summer |
0.040-0.080 |
||
|
i. Medium to dense brush in winter |
0.045-0.110 |
||
|
j. Medium to dense brush in summer |
0.070-0.160 |
||
|
k. Trees, dense willows summer, straight |
0.110-0.200 |
||
|
l. Trees, cleared land with tree stumps, no sprouts |
0.030-0.050 |
||
|
m. Trees, cleared land with tree stumps, with sprouts |
0.050-0.080 |
||
|
n. Trees, heavy stand of timber, few down trees, flood stage below branches |
0.080-0.120 |
||
|
o. Trees, heavy stand of timber, few down trees, flood stage reaching branches |
0.100-0.160 |
||
|
3. Major streams (top width at flood stage > 100 ft) |
|||
|
a. Regular section with no boulders or brush |
0.025-0.060 |
||
|
b. Irregular rough section |
0.035-0.100 |
||
|
B. Excavated or dredged channels |
|||
|
1. Earth, straight and uniform |
|||
|
a. Clean, recently completed |
0.016-0.020 |
||
|
b. Clean, after weathering |
0.018-0.025 |
||
|
c. Gravel, uniform section, clean |
0.022-0.030 |
||
|
d. With short grass, few weeds |
0.022-0.033 |
||
|
2. Earth, winding and sluggish |
|||
|
a. No vegetation |
0.023-0.030 |
||
|
b. Grass, some weeds |
0.025-0.033 |
||
|
c. Deep weeds or aquatic plants in deep channels |
0.030-0.040 |
||
|
d. Earth bottom and rubble sides |
0.028-0.035 |
||
|
e. Stony bottom and weedy banks |
0.025-0.040 |
||
|
f. Cobble bottom and clean sides |
0.030-0.050 |
||
|
g. Winding, sluggish, stony bottom, weedy banks |
0.025-0.040 |
||
|
h. Dense weeds as high as flow depth |
0.050-0.120 |
||
|
3. Dragline-excavated or dredged |
|||
|
a. No vegetation |
0.025-0.033 |
||
|
b. Light brush on banks |
0.035-0.060 |
||
|
4. Rock cuts |
|||
|
a. Smooth and uniform |
0.025-0.040 |
||
|
b. Jagged and irregular |
0.035-0.050 |
||
|
5. Unmaintained channels |
|||
|
a. Dense weeds, high as flow depth |
0.050-0.120 |
||
|
b. Clean bottom, brush on sides |
0.040-0.080 |
||
|
c. Clean bottom, brush on sides, highest stage |
0.045-0.110 |
||
|
d. Dense brush, high stage |
0.080-0.140 |
||
|
C. Lined channels |
|||
|
1. Asphalt |
0.013-0.016 |
||
|
2. Brick (in cement mortar) |
0.012-0.018 |
||
|
3. Concrete |
|
||
|
a. Trowel finish |
0.011-0.015 |
||
|
b. Float finish |
0.013-0.016 |
||
|
c. Unfinished |
0.014-0.020 |
||
|
d. Gunite, regular |
0.016-0.023 |
||
|
e. Gunite, wavy |
0.018-0.025 |
||
|
4. Riprap (n-value depends on rock size) |
0.020-0.035 |
||
|
5. Vegetal lining |
0.030-0.500 |
||
|
Type of gutter or pavement |
Manning’s n |
|---|---|
|
Concrete gutter, troweled finish |
0.012 |
|
Asphalt pavement: smooth texture |
0.013 |
|
Asphalt pavement: rough texture |
0.016 |
|
Concrete gutter with asphalt pavement: smooth texture |
0.013 |
|
Concrete gutter with asphalt pavement: rough texture |
0.015 |
|
Concrete pavement: float finish |
0.014 |
|
Concrete pavement: broom finish |
0.016 |
|
Table 4-8 note: For gutters with small slope or where sediment may accumulate, increase n values by 0.02 (USDOT, FHWA 2001). |
|
|
Material |
Manning’s n |
|
|---|---|---|
|
Asbestos-cement pipe |
0.011-0.015 |
|
|
Brick |
0.013-0.017 |
|
|
Cast iron pipe |
|
|
|
|
Cement-lined & seal coated |
0.011-0.015 |
|
Concrete (monolithic) |
|
|
|
|
Smooth forms |
0.012-0.014 |
|
|
Rough forms |
0.015-0.017 |
|
|
Concrete pipe |
0.011-0.015 |
|
|
Box (smooth) |
0.012-0.015 |
|
Corrugated-metal pipe -- (2-1/2 in. x 1/2 in. corrugations) |
|
|
|
|
Plain |
0.022-0.026 |
|
|
Paved invert |
0.018-0.022 |
|
|
Spun asphalt lined |
0.011-0.015 |
|
|
Plastic pipe (smooth) |
0.011-0.015 |
|
Corrugated-metal pipe -- (2-2/3 in. by 1/2 in. annular) |
0.022-0.027 |
|
|
Corrugated-metal pipe -- (2-2/3 in. by 1/2 in. helical) |
0.011-0.023 |
|
|
Corrugated-metal pipe -- (6 in. by 1 in. helical) |
0.022-0.025 |
|
|
Corrugated-metal pipe -- (5 in. by 1 in. helical) |
0.025–0.026 |
|
|
Corrugated-metal pipe -- (3 in. by 1 in. helical) |
0.027–0.028 |
|
|
Corrugated-metal pipe -- (6 in. by 2 in. structural plate) |
0.033–0.035 |
|
|
Corrugated-metal pipe -- (9 in. by 2-1/2 in. structural plate) |
0.033–0.037 |
|
|
Corrugated polyethylene |
0.010–0.013 |
|
|
|
Smooth |
0.009-0.015 |
|
|
Corrugated |
0.018–0.025 |
|
Spiral rib metal pipe (smooth) |
0.012-0.013 |
|
|
Vitrified clay |
|
|
|
|
Pipes |
0.011-0.015 |
|
|
Liner plates |
0.013-0.017 |
|
Polyvinyl chloride (PVC) (smooth) |
0.009-0.011 |
|
|
Table 4-9 note: Manning’s n for corrugated pipes is a function of the corrugation size, pipe size, and whether the corrugations are annular or helical (see USGS 1993). |
||