Chapter 4: ARI & Report Processing
Anchor: #i1016235Section 1: Automated Road Inventory Diagram
Anchor: #i1016242What is an ARI?
ARI is the acronym for Automated Roadway Inventory diagram. It takes information from TRM and creates an automated straight-line diagram of the selected route:
- ARI replaces the previously hand-drawn RI-1 diagram, which is a visual roadway record by TPP, showing all highways maintained by the department
- ARI allows the TRM user to produce an accurate and current graphical representation of any desired segment of highway in TRM
- ARI is a computer-generated straight-line diagram of a
highway that consists of two parts: graphics and text
- The graphics portion of the diagram appears across the middle of the page showing features and readings (DFO, DIS, or both) of the roadway
- The text appears above and/or below the graphics and shows roadbed specific and administrative attribute data. Click ARI diagram to view a sample ARI.
Processing an ARI involves steps in three different systems: TRM, ROSCOE Mainframe, and MicroStation software. Follow the input instructions to process an ARI diagram.
Anchor: #i1016303TRM System ARI Processing
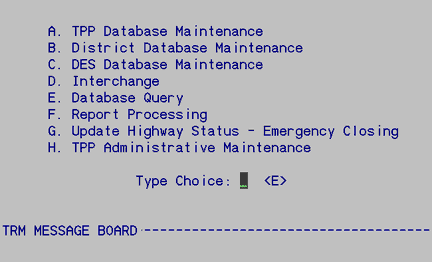
Log on to TRM; the Texas Reference Marker System Main Menu appears:
Figure 4-1. Texas Reference Marker System Main Menu.
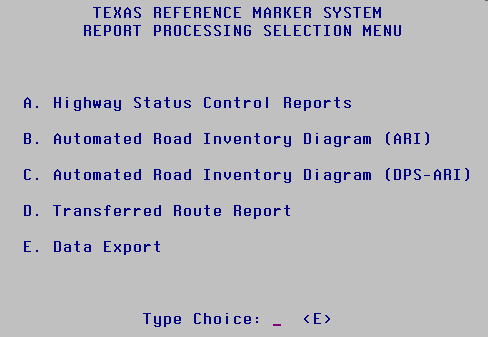
Input an ‘F’ in Type Choice and press <E>; the Report Processing Selection Menu appears:
Figure 4-2. Report Processing Selection Menu.
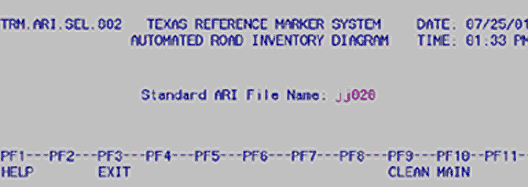
For an ARI, input ‘B’ in Type Choice and press <E>; the Standard ARI File Name screen appears:
Figure 4-3. Standard ARI File Name screen.
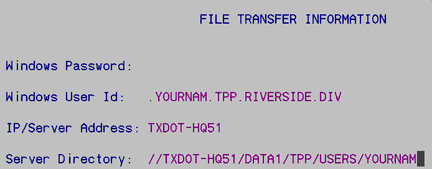
Enter an easy-to-remember name for the file (i.e. IH035, US290; first character must be a letter) and press <E>; the File Transfer Information screen appears:
Figure 4-4. The System enters the IP Address and Server Directory for you.
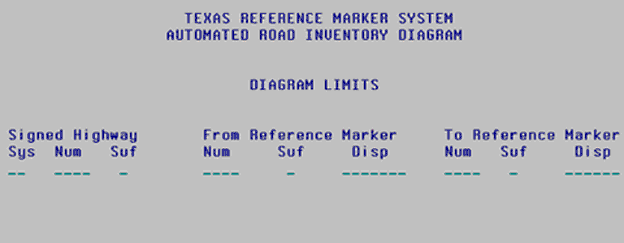
Input your User Id and top secret Windows Password and press <E>; the Diagram Limits screen appears:
Figure 4-5. Diagram Limits screen.
This table lists the Required/Optional input fields on the Diagram Limits screen:
|
Field |
Required/Optional |
|---|---|
|
Signed Highway |
|
|
From Reference Marker |
|
|
To Reference Marker |
|
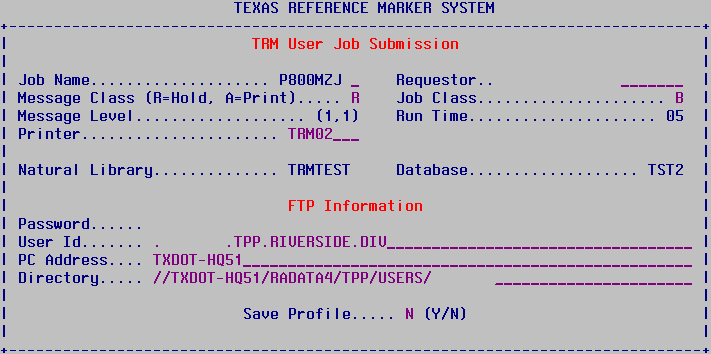
Input all required plus any optional fields and press <E>. The system searches for information within the specific Signed Highway and Reference Marker range, then the TRM User Job Submission dialog box appears:
Figure 4-6. TRM User Job Submission dialog box.
This table explains the five input fields on the TRM User Job Submission dialog box:
|
Field |
Description |
Format |
Default Value |
Valid Values |
|---|---|---|---|---|
|
Requestor |
Name of report requestor |
19 alpha |
None |
All characters |
|
Printer |
VPS Printer Id assigned to the target mainframe printer |
4 alpha |
Default printer Id |
Any valid printer Id |
|
Msg Class |
Value determines whether the system holds the output for review or prints automatically |
1 alpha |
None |
(R)eview or (A)utomatic print |
|
Job Name |
Name given to the job for access in ROSCOE; the last character must be entered to differentiate one report from another |
1 alpha |
None |
A-Z, 0-9 |
|
Save Profile |
Value determines whether the system saves Requestor, Printer, and Msg Class fields |
1 alpha |
(N)o |
(Y)es or (N)o |
NOTE: After saving the profile, the values in the first three fields will always appear the same. If any of the fields change, save the profile again.
Make modifications to the TRM User Job Submission pop-up window and press <F2>.
Important: Remember the Job Name! You need it to identify your job in ROSCOE output.
Figure 4-7. Success message. Remember the Job Name!
A message indicates that the job was submitted successfully. Press <F12> to exit TRM and log-off the mainframe, then access the submitted job through ROSCOE.
Anchor: #i1016470ROSCOE ARI Processing
Follow these input instructions to continue processing the ARI thru ROSCOE:
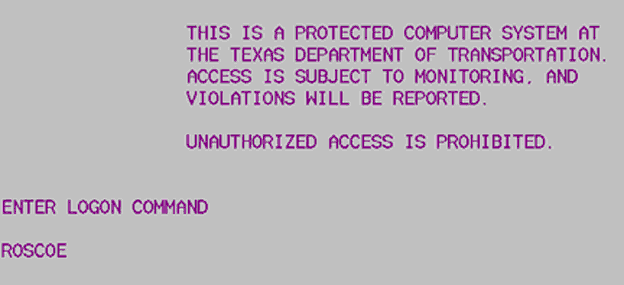
Double-click on the computer desktop Mainframe icon and the initial mainframe screen appears. Input the name of your regional central ROSCOE site and press <E>:
Figure 4-8. Start-up page for mainframe sessions.
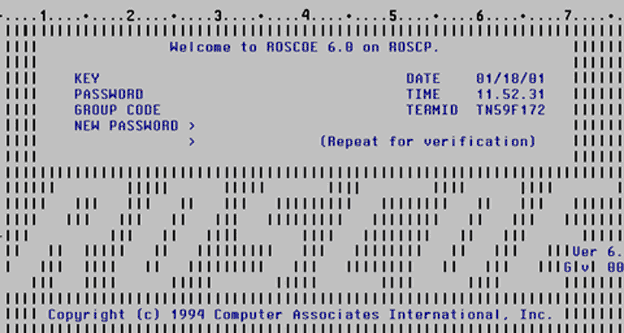
The ROSCOE signon screen appears:
Figure 4-9. ROSCOE sign-in.
Input your Key (User Id) Number and top secret Password and press <E>; continue pressing <E> through all message screens; a blank screen appears:
Figure 4-10. Blank screen for DOUT.
Input ‘DOUT’ at the cursor and press <E>; the PC.DOUT screen appears:
Figure 4-11. PC.DOUT screen.
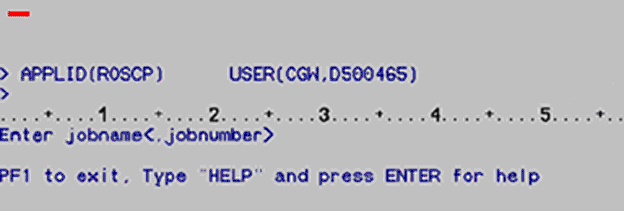
At the cursor, input the Jobname from the TRM report process and press <E>; all jobs with your jobname appear along with the status of the jobs:
Figure 4-12. Jobname screen.
This table describes the Jobname screen:
|
Column |
Description |
|---|---|
|
JOBNO |
System-assigned job number |
|
JOBNAME |
Name of the job entered in the TRM User Job Submission pop-up window |
|
STATUS |
Status of the job:
|
|
C |
Message Class--A, R, or blank |
|
ORIGIN |
Destination of output—this is the printer Id entered in the TRM User Job Submission pop-up window |
|
Step |
If STATUS of the job is EXECUTING, the queue position of the job is listed here [example: POS(2) means “queue position number 2”] |
|
NOTE: If the submitted job is message class = A (automatic print), the output goes to the printer named in the Job Submittal pop-up window. Do not continue with the next step |
|
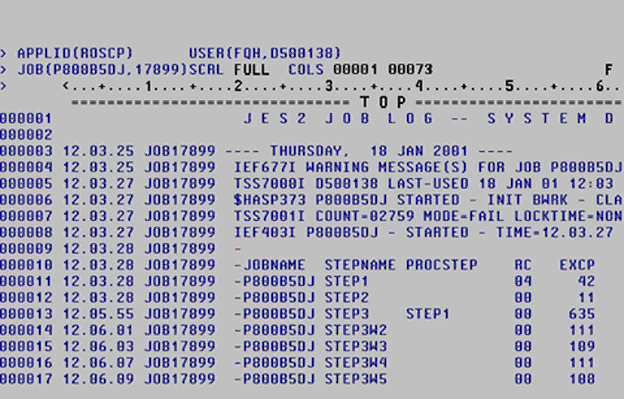
Select the job to review under the JOBNO column. If more than one job is listed, input the number of the job to review and press <F2>. If only one job is listed, press <F2>. The first page of the job appears:
Figure 4-13. Job Log screen.
To view the output, input ‘NEXT FILE’ to scroll forward through the job or ‘PREV FILE’ to scroll backward.
To exit this screen, input ‘DOFF’ at the cursor and press <E>; the system returns to the mainframe logon screen.
Continue to Generating an ARI Diagram; ROSCOE does not print the ARI.
Anchor: #i1016601Generating an ARI Diagram
Follow these input instructions to generate and plot (print) an ARI diagram.
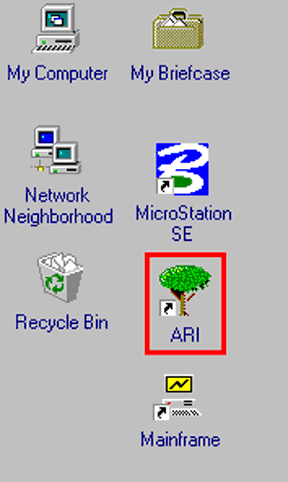
Select the ARI icon on your computer desktop:
Figure 4-14. ARI Icon.
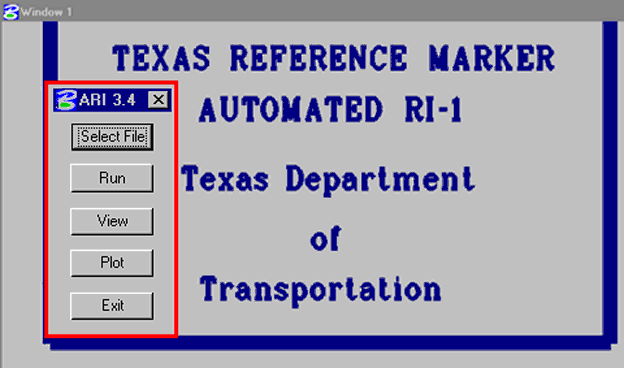
This opens the ARI MicroStation software that runs within the MicroStation PC environment. The Automated RI-1 screen appears. Press the <PF2> key to display the ARI toolbar:
Figure 4-15. Automated RI-1 screen and ARI toolbar.
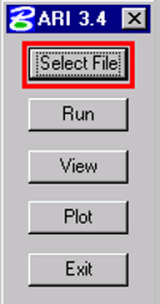
Choose ‘Select File’ on the ARI toolbar:
Figure 4-16. ARI Toolbar.
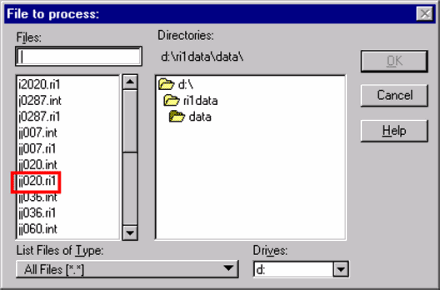
The File to Process window appears. Select the “.ri1” highway file you created in ROSCOE and select OK:
Figure 4-17. Example file selected.
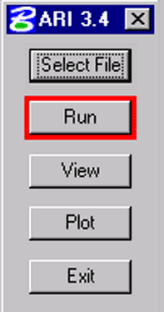
On the ARI Toolbar, select ‘Run’:
Figure 4-18. ‘Run’ creates the ARI.
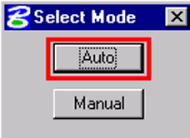
The Select Mode dialog box appears:
Figure 4-19. ‘Auto’ is a preset miles-per-page increment.
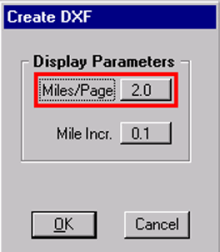
Select ‘Auto’ (preferred) for 0.5 mile per page or ‘Manual’ for any other mileage increment. If you select ‘Manual’, the Create DXF dialog box appears to allow you to change the miles per page and the mileage increment. On the Create DXF dialog box, select ‘Miles/Page’:
Figure 4-20. Select miles per page.
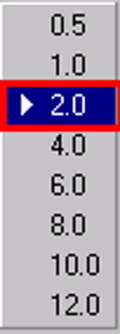
This drop-down box appears. Select the desired miles per ARI page (0.5 - 12.0):
Figure 4-21. Select mileage.
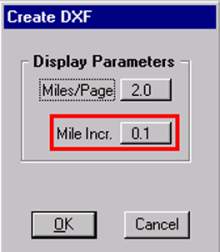
On the Create DXF dialog box, select ‘Mile Incr.’:
Figure 4-22. Select mileage increments.
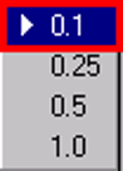
This drop-down box appears. Select the desired mileage increment (0.1 - 1.0):
Figure 4-23. Select increment.
EXAMPLE: In the ARI diagram sample, the analyst selected 2 miles per page (shows the roadbed, attributes, and features for 2 miles of the roadway) at 0.1 mile increments (0.1, 0.2, 0.3, etc., scaled across the top of the diagram).
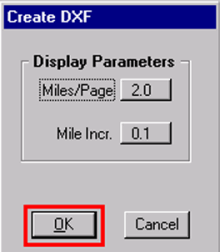
Select ‘OK’ to exit the Create DXF dialog box.
Figure 4-24. Select ‘OK’ or change choices.
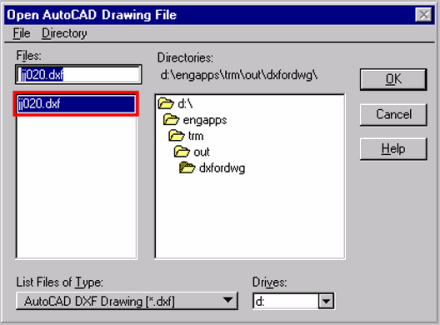
The Open AutoCAD Drawing File window appears; select the “.dxf” file of the highway file you created in ROSCOE and select ‘OK’:
Figure 4-25. Example file selected.
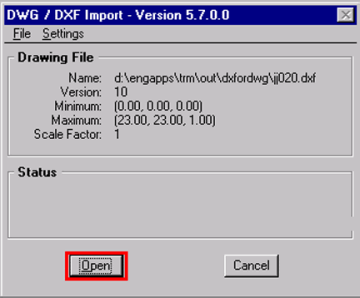
The DWG/DXF Import dialog box appears. Select ‘Open’:
Figure 4-26. ‘Open’ processes the ARI.
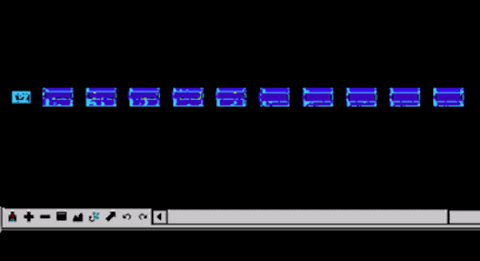
This creates the ARI log sheets, which appear as in Figure 3‑51:
Figure 4-27. This ARI contains 11 pages.
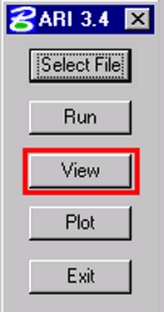
To customize the ARI, select ‘View’ on the ARI Toolbar:
Figure 4-28. ‘View’ changes which features appear on the ARI pages.
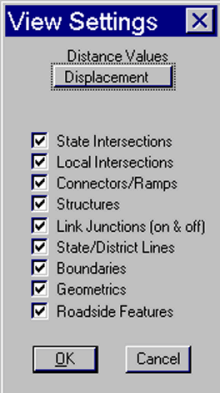
The View Settings dialog box appears:
Figure 4-29. Shows Distance Values and features options.
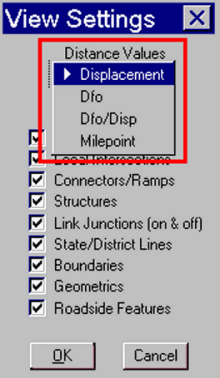
Select a ‘Distance Value’ of
- Reference Marker + Displacement
- Distance From Origin ( DFO)
- Distance From Origin and Reference Marker + Displacement (DFO/Disp), or
- Milepoint only.
The ‘Distance Value’ determines how closely the ARI features appear:
Figure 4-30. Select one from the list.
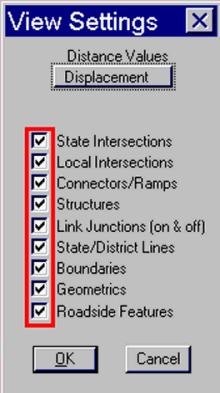
Select features to appear on the ARI by clicking the box beside the feature. Click on a check mark to remove it. When you finish selecting features, select ‘OK’:
Figure 4-31. Select all or only a few to appear on the ARI.
Anchor: #i1016917Editing an ARI Diagram
At this point in creating an ARI, you may want to edit some of the features on the diagram to make it easier to read. This toolbar appears at the bottom of the ARI screen:
Figure 4-32. MicroStation view toolbar.
This table describes the various tools:
|
Button |
Select this button(s): |
|---|---|
|
Update |
After making changes to the diagram |
|
Zoom In and Out |
Make the view larger or smaller |
|
Window |
Draw a window around a small area to view in a larger screen |
|
Fit View |
Fit all the diagram pages on the screen |
|
Move |
Move a feature for clearer viewing |
|
Copy |
Copy a feature to place it elsewhere on the diagram |
|
Delete |
Delete a feature |
|
Rotate |
Rotate a feature for clearer viewing |
For further instructions, please consult the MicroStation user’s manual.
Anchor: #i1016946Plotting an ARI Diagram
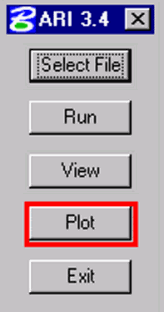
On the ARI Toolbar, select ‘Plot’:
Figure 4-33. Plot = print.
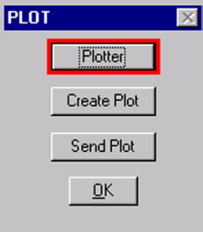
This displays the Plot dialog box. Select ‘Plotter’:
Figure 4-34. Choose the plotter first.
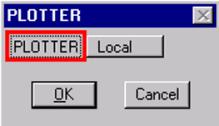
The Local or Network plotting selection box appears:
Figure 4-35. Select your choice of local or network.
Select a plotter by these guidelines:
- A local plotter connects to the LPT port of your PC
- A network plotter connects to a network printer defined in the print manager under Windows NT.
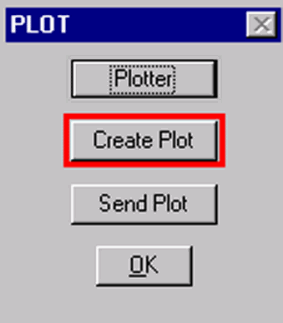
Select ‘OK’ on the plotter selection box, then select ‘Create Plot’ on the Plot dialog box:
Figure 4-36. This invokes the program that makes the ARI printable.
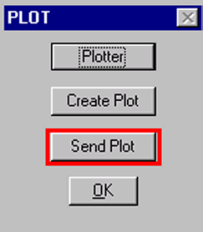
The system creates the plot files. Finally, select ‘Send Plot’:
Figure 4-37. Send plot to plotter/printer.
This sends the plot files to the plotter. A window appears showing which files are plotted and sent to the printer.
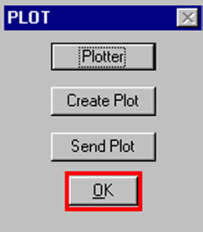
Select ‘OK’:
Figure 4-38.
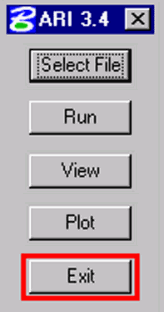
and exit Microstation before generating another ARI:
Figure 4-39. Exit the ARI software, then exit Microstation.
Anchor: #i1017079Generating Another ARI Diagram
Windows NT takes over plotting the ARI after you send the files to the plotter. You may exit MicroStation and generate another ARI diagram before the plotting finishes. Return to the TRM Main Menu and repeat the process to produce another ARI diagram.
